
Pavement Marking Inventory using GIS and Computer Vision – Part II
Aligned with the City of Surrey’s Digital Transportation Strategy, which aims to create a user-centric and data-driven Intelligent Transportation System, significant strides were made in 2022. The city collaborated with a student from the GIS Department at the British Columbia Institute of Technology (BCIT) to develop a deep learning model. This model automates the collection of pavement marking assets using computer vision and deep learning.
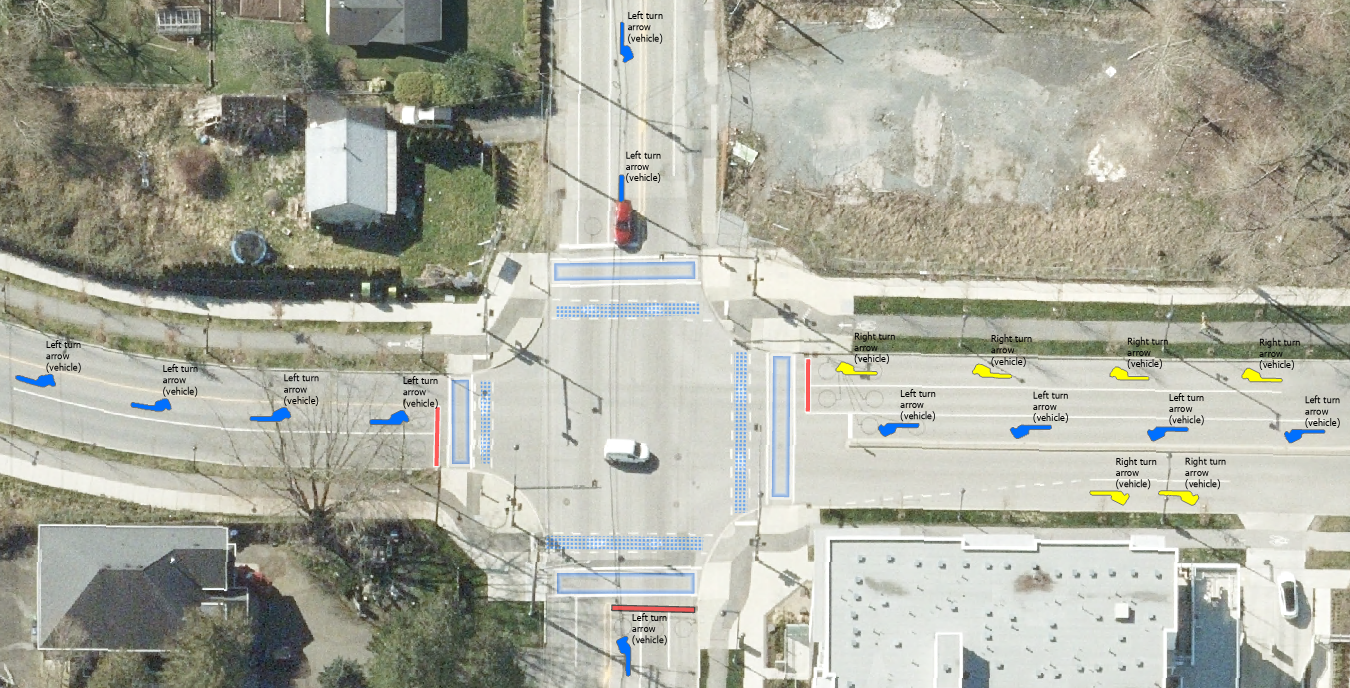
The deep learning model that was developed successfully extracted pavement markings from high-resolution aerial imagery, producing various feature classes such as arrows, stop bars, crosswalks, bicycles, gore areas, and pavement colours, as depicted in Figure 1. However, the initial output contained potential false detections, which necessitated the development of validation workflows. These workflows aim to filter out inaccuracies and assess the model’s accuracy, enabling necessary fine-tuning before its deployment for generating new pavement markings. Once an acceptable level of detection accuracy was achieved, these detected objects could be confidently converted into reliable production features.
Over the past few months, I have been working with the City of Surrey building on the phase 1 results of the pavement marking inventory pilot project for my industry practicum at BCIT. The primary goal of phase 2 was to develop semi-automated validation workflows that optimize the refinement process of the deep learning model’s results before their transition into operational features.
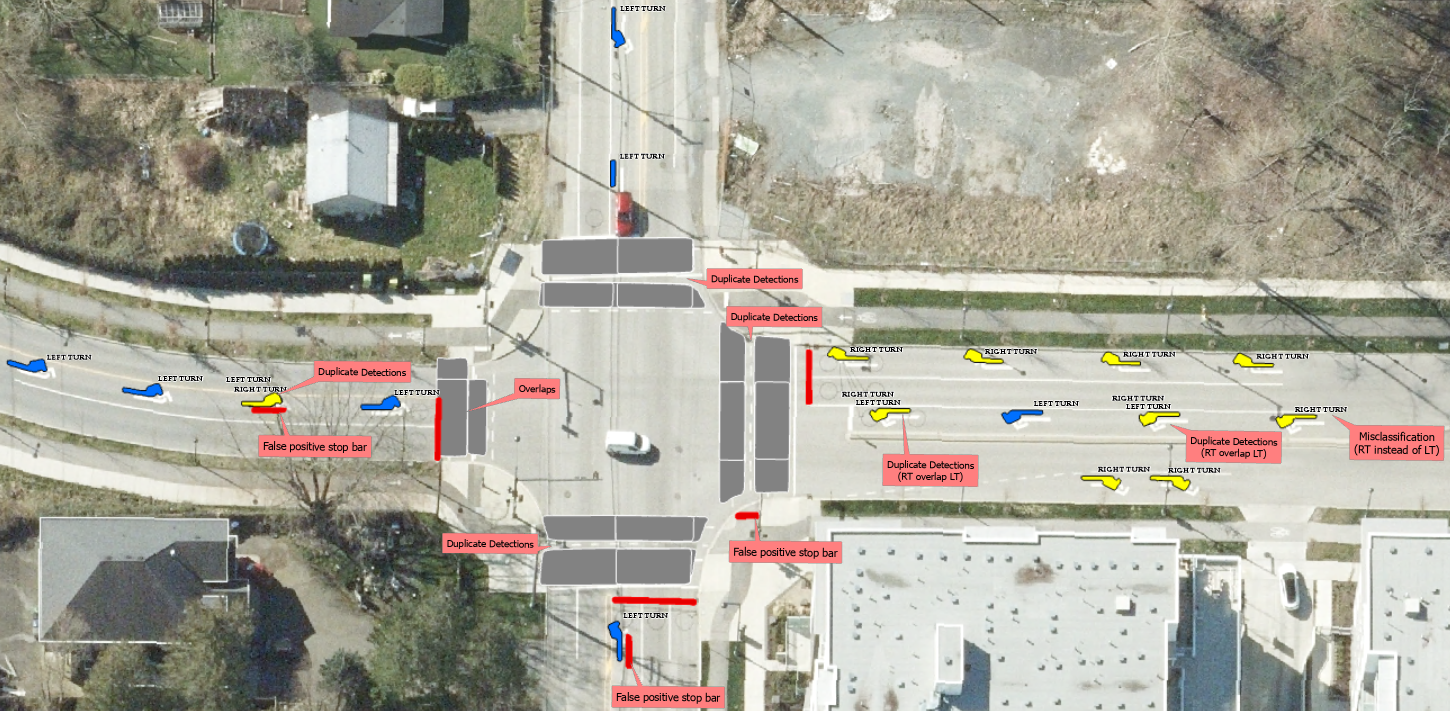
Here are the common types of false detections that occurred in the outputs of a deep learning model, which include:
False Positives: This is where the model incorrectly identifies a non-marking area or object as a pavement marking. This could be due to similar color or shape features between the actual markings and other elements in the orthophotographs.
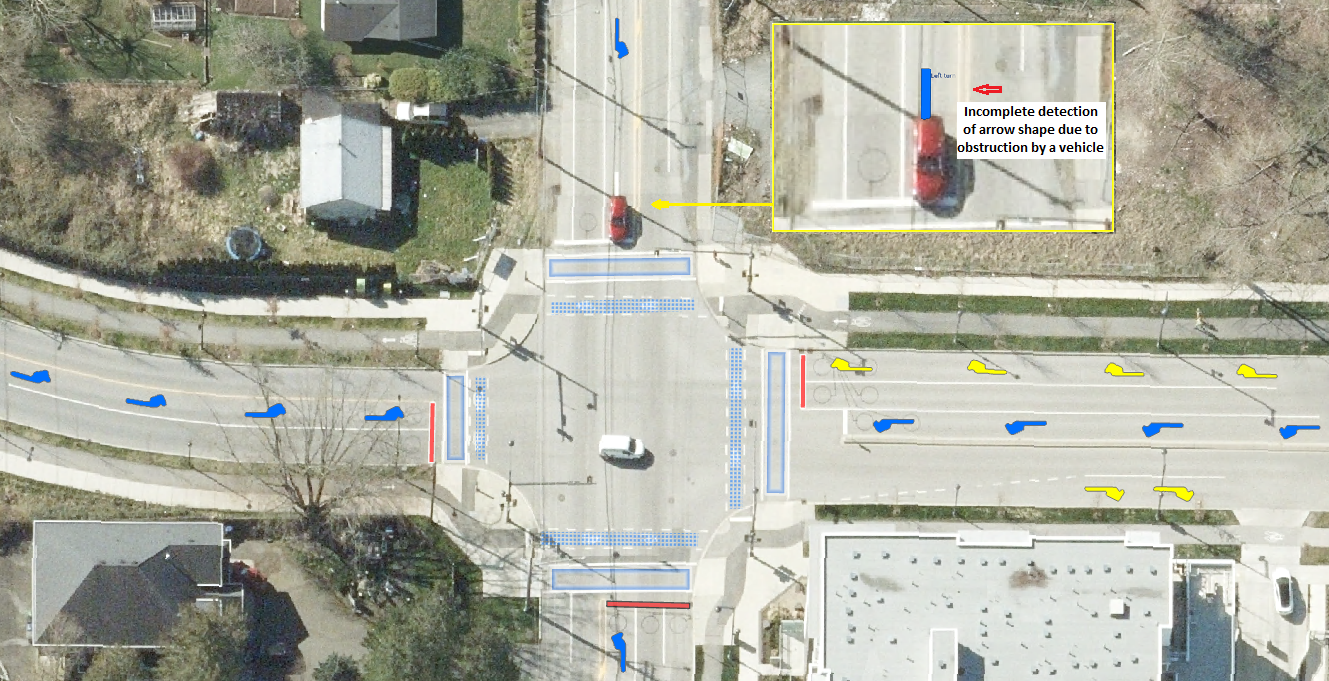
False Negatives: This is where the model fails to identify actual pavement markings. This can occur if the markings are faded, partially obscured, or if they fall outside the normal range of shapes, sizes, or colors that the model was trained on.
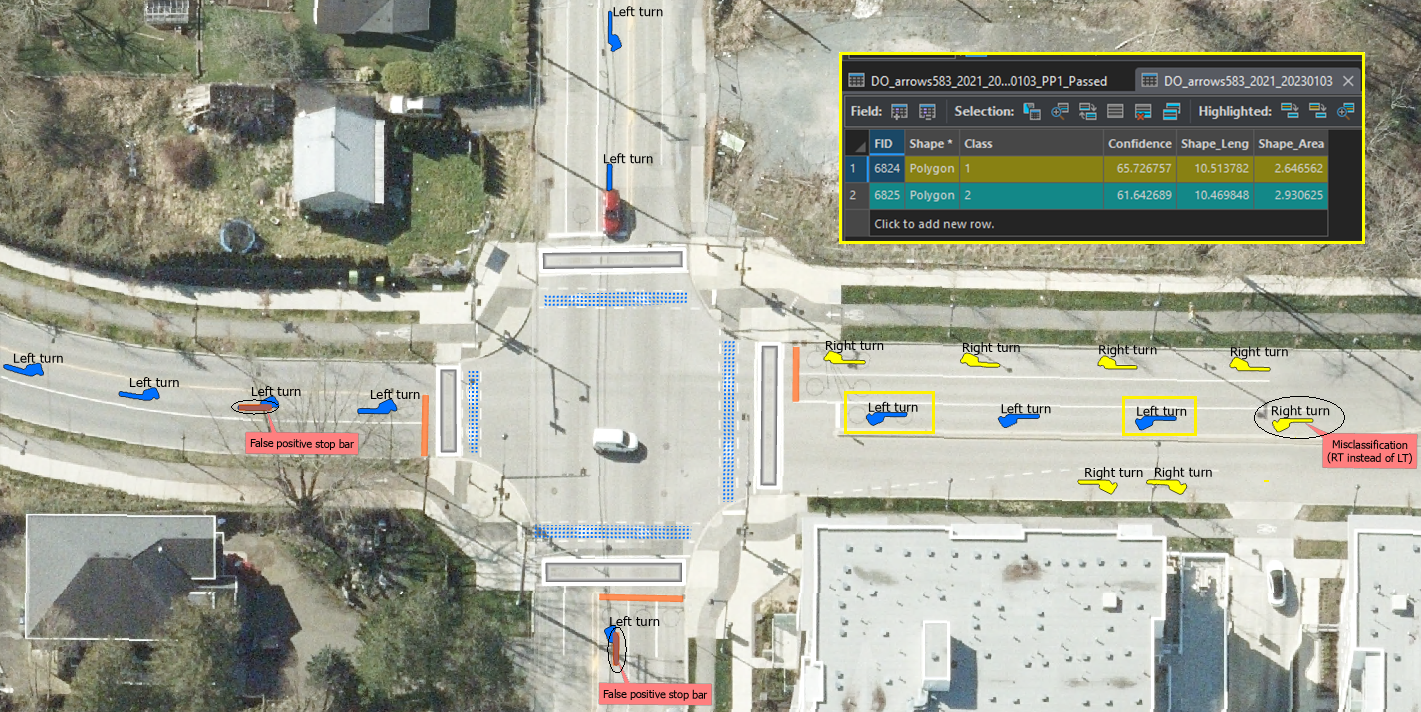
Misclassifications: The model might correctly identify a marking, but misclassify it. For instance, it could mistake a stop line for a crosswalk or confuse sub-types of arrows, such as misidentifying a left-turn symbol as a right-turn symbol.
Duplicate Detections: The model might “double count” markings, identifying them as separate when they are part of the same marking. This might occur if the marking is partially obscured or if the photograph is taken at an angle that makes a continuous marking appear discontinuous.
Developing Semi-Automated Data Validation Workflows Using ArcGIS ModelBuilder and Esri Tasks
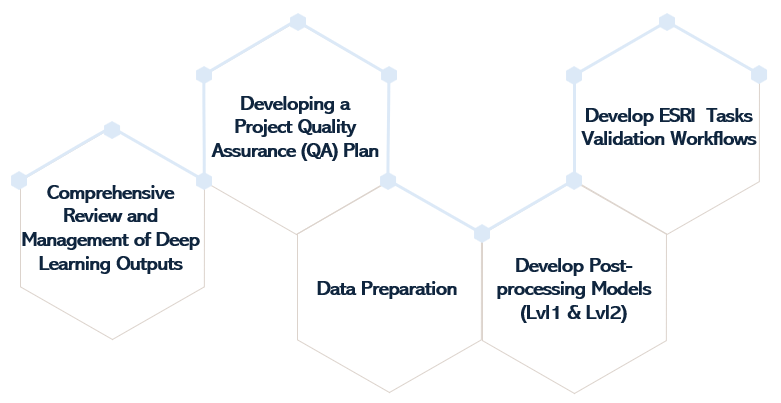
The methodology for implementing Phase 2 objectives involved a thorough review of the deep learning outputs and a clear understanding of the business requirements and placement standards for the types of pavement markings generated during Phase 1 of the project. This also considered their relationship with intersections, bike routes, railway crossings, road classes, and certain types of buildings. This process further entailed the development of a Quality Assurance (QA) plan, which translated these business requirements into data quality rules. Additional steps included identifying and preparing the necessary layers for the development of automated post-processing levels, using Data Reviewer (attribute validation rules) for manual data validation, and ultimately, generating the final, validated pavement marking feature classes.
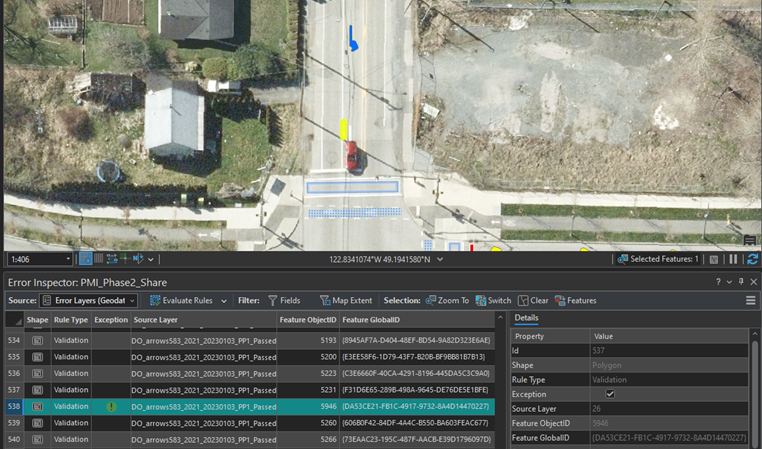
To streamline the entire process, custom Tasks were developed. Each Task consisted of preconfigured steps designed to guide users through the validation workflow. Figure 3 illustrates this sequence within an Esri Task. These tasks facilitated a two-level automated post-processing, applying a validation attribute for the manual review and validation of errors that could not be filtered through the post-processing workflows. Ultimately, these processes led to the generation of the final, validated pavement marking feature classes.
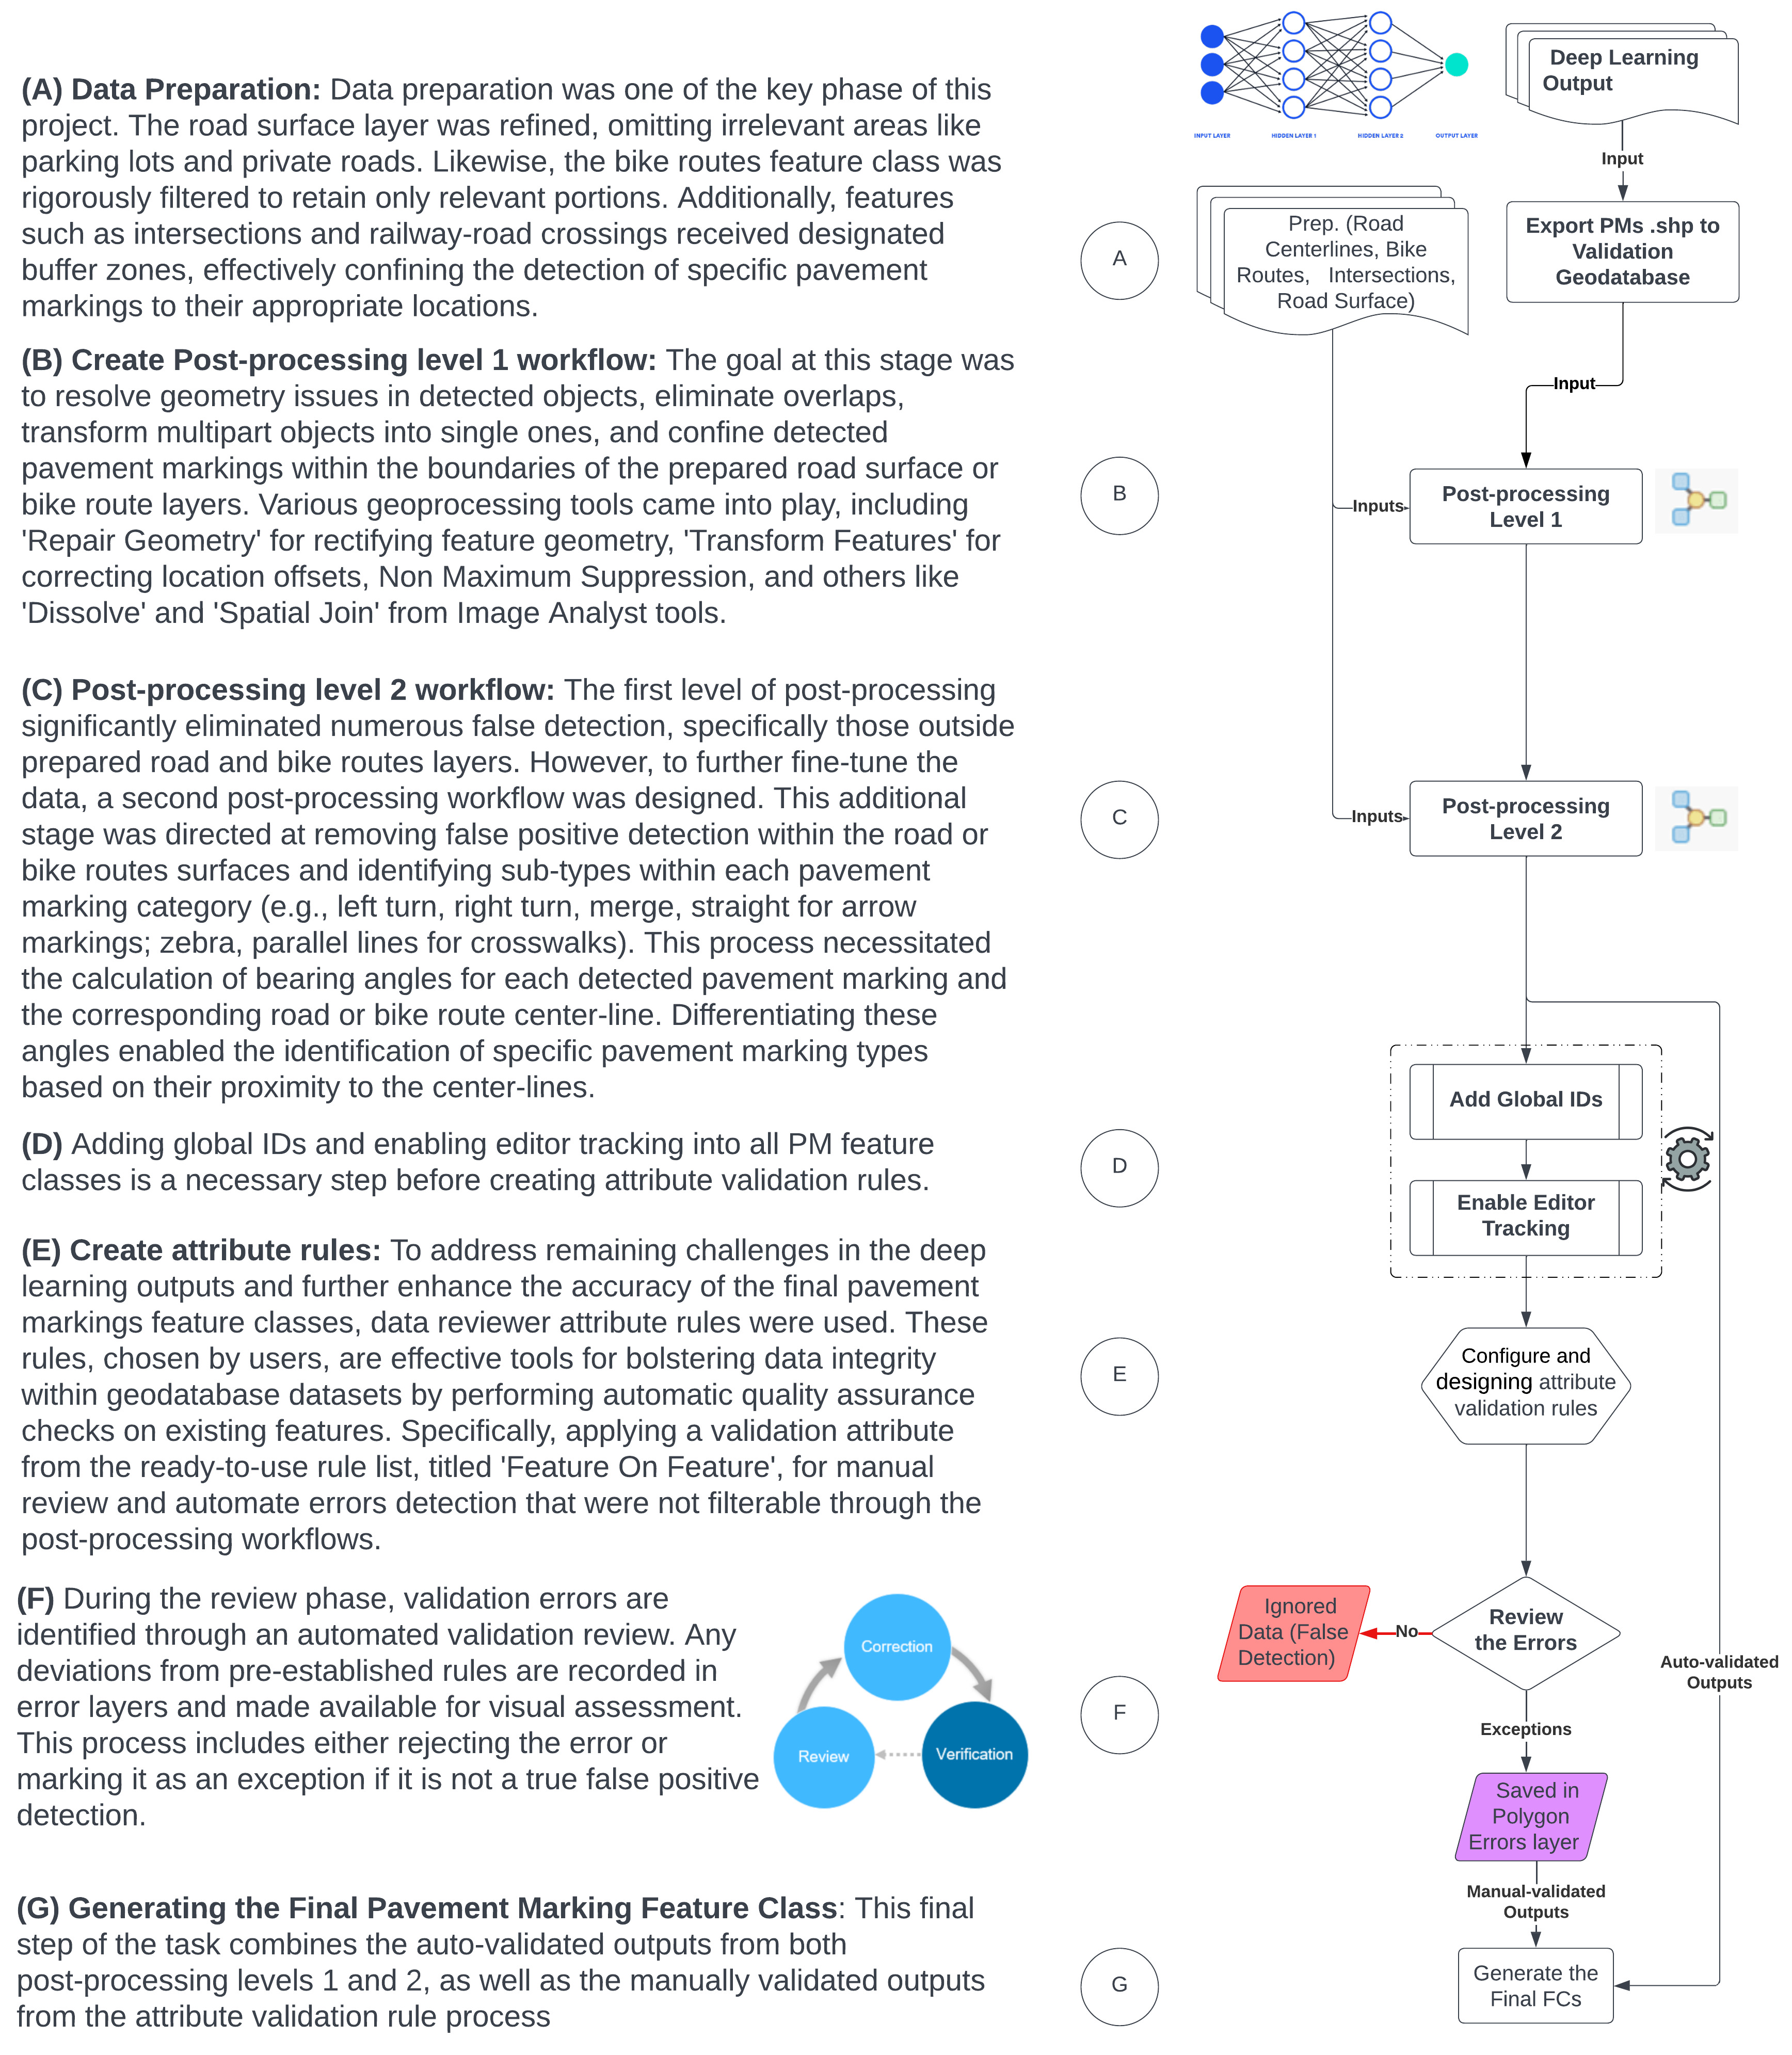
The phase 2 proficiently employed ArcGIS Pro’s ModelBuilder, geoprocessing tools, and Tasks. It led to the successful development of semi-automated validation workflow Tasks for pavement markings, such as Arrows, Stop Bars, Rare Cases, and Crosswalks. encompassing two levels of post-processing and a data reviewer-attribute rule level.
Despite the data and business rules limitations preventing completion of post-processing level 2 for bicycles, pavement color, and gore area pavement marking types, the methods used significantly elevated the quality of most pavement marking feature classes. The process ensured that over 90% of the data was automatically validated, leaving less than 10% that required manual inspection and validation.
Stay tuned for Part III of this blog series, where the city will leverage these validated pavement marking assets to develop a system of engagement. This will include the use of ArcGIS field apps and a dashboard. City staff and/or external contractors will be able to interact with the pavement marking assets inventory, perform queries, calculate basic statistics, update condition scores as needed, and enhance operational awareness.