
Interning at CBRE’s Location Intelligence Team
Introduction
CBRE is a commercial real estate firm devoted to providing clients with top of the line real estate services. One of these services happens to be using GIS to locate and call attention to areas which fit a client’s desired location for future development or relocation. As a BCIT student currently in their Advanced Diploma in Geographic Information Systems program, part of my curriculum requirement is that I enter into an internship at a company involved with GIS. I was fortunate enough to acquire an internship at CBRE under the guidance of Naz Ali and her Location Intelligence team. In this post, I will showcase some of the projects and tasks I was given while interning at CBRE as a GIS student.
Map Library
CBRE’s Map Library, a creation by Naz Ali, is a web application showcasing demographic variables at various census levels. The Map Library is very useful for quickly accessing demographic information such as income, population, or spending data which can then be used by brokers to better serve their clients.
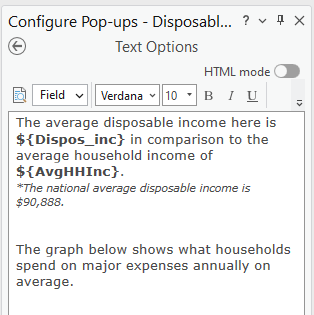
My task was to update the Map Library from 2022 data to 2023 data. This task involved using the 2022 .lyrx files to import their symbology to the 2023 .shp data files. I then configured pop-ups in ArcGIS pro to fit the same configuration as the 2022 pop-ups. Below is an example of what configuring the pop-up looks like.
Using Alteryx for Map Library Pop-ups
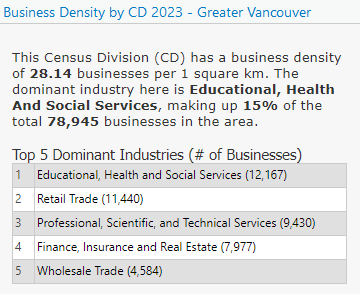
For one Map Library layer in particular, Naz asked me to see if I could figure out how to display the top five values of each row for a given set of 15 fields. This layer displayed the business density of each demographic area at multiple census divisions. Below is an example of what the attribute table looked like, note the table is simplified for ease of explanation.
| CDUID | Agriculture | Manufacturing | Other |
| 15623 | 109 | 27 | 49 |
| 16234 | 60 | 51 | 19 |
| 17322 | 31 | 23 | 108 |
The desired product for the first CDUID pop-up for example would then be:
• 1 | Agriculture (109)
• 2 | Other (49)
• 3 | Manufacturing (27)
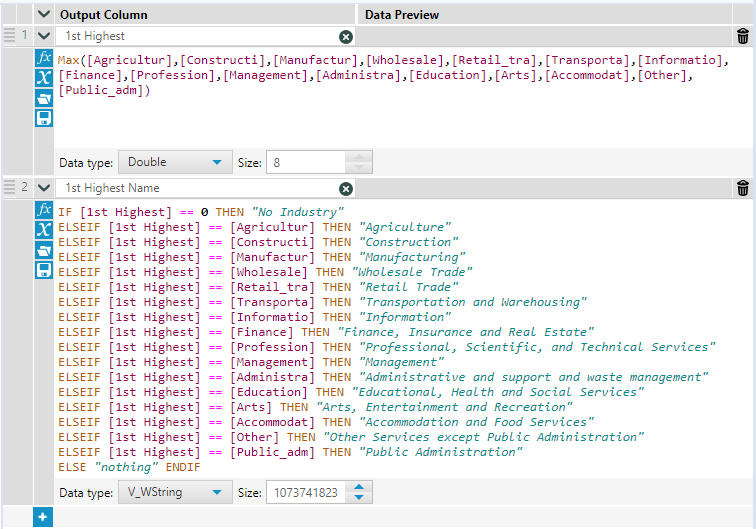
To speed up the process of achieving this desired product, I exported the table into Alteryx where I could leverage the Alteryx toolset. In Alteryx, I utilized the Formula tool and the max() function to create a new field representing the maximum value among the 15 industry type fields. Additionally, I generated another field containing the corresponding industry type name for this maximum value. By cross-referencing the number of businesses per industry type with the previously calculated maximum value, I assigned the appropriate industry names. The resulting dataset included two fields: ‘1st highest’ and ‘1st highest name’. To determine the second-highest value and its associated industry name, I followed a similar process, iteratively checking for matches between the ‘1st highest’ field and the remaining 15 fields. Setting the corresponding field to zero allowed me to identify the second-highest value using the max() function again, as the original highest value had been adjusted to zero.
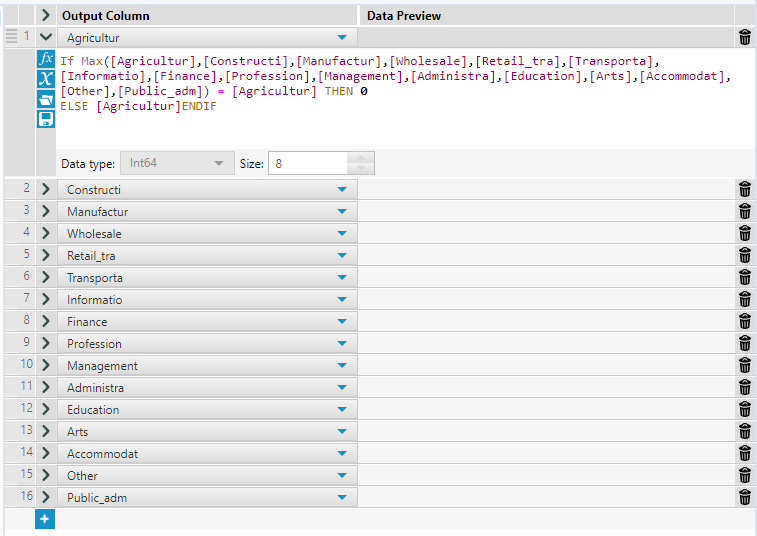
This process was then repeated three more times using the same functions to achieve the top five highest number of businesses for each census division area. The only step left was to combine the max values with the max value names to create the five final fields which would then be used for the Map Library pop-ups. The first image below is of the first formula tool which will grab the highest value and then create a name field relating to the highest industry type. The second image below showcases the formula tool responsible for removing the values of the highest industry type, these two formula tools are repeated four more times in total.
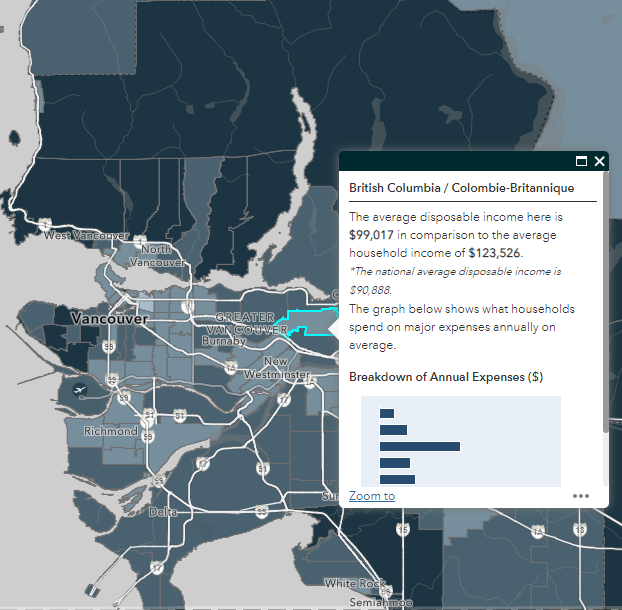
Below is an example of what the final pop-up looks like in ArcGIS Pro.
Alteryx Workflows
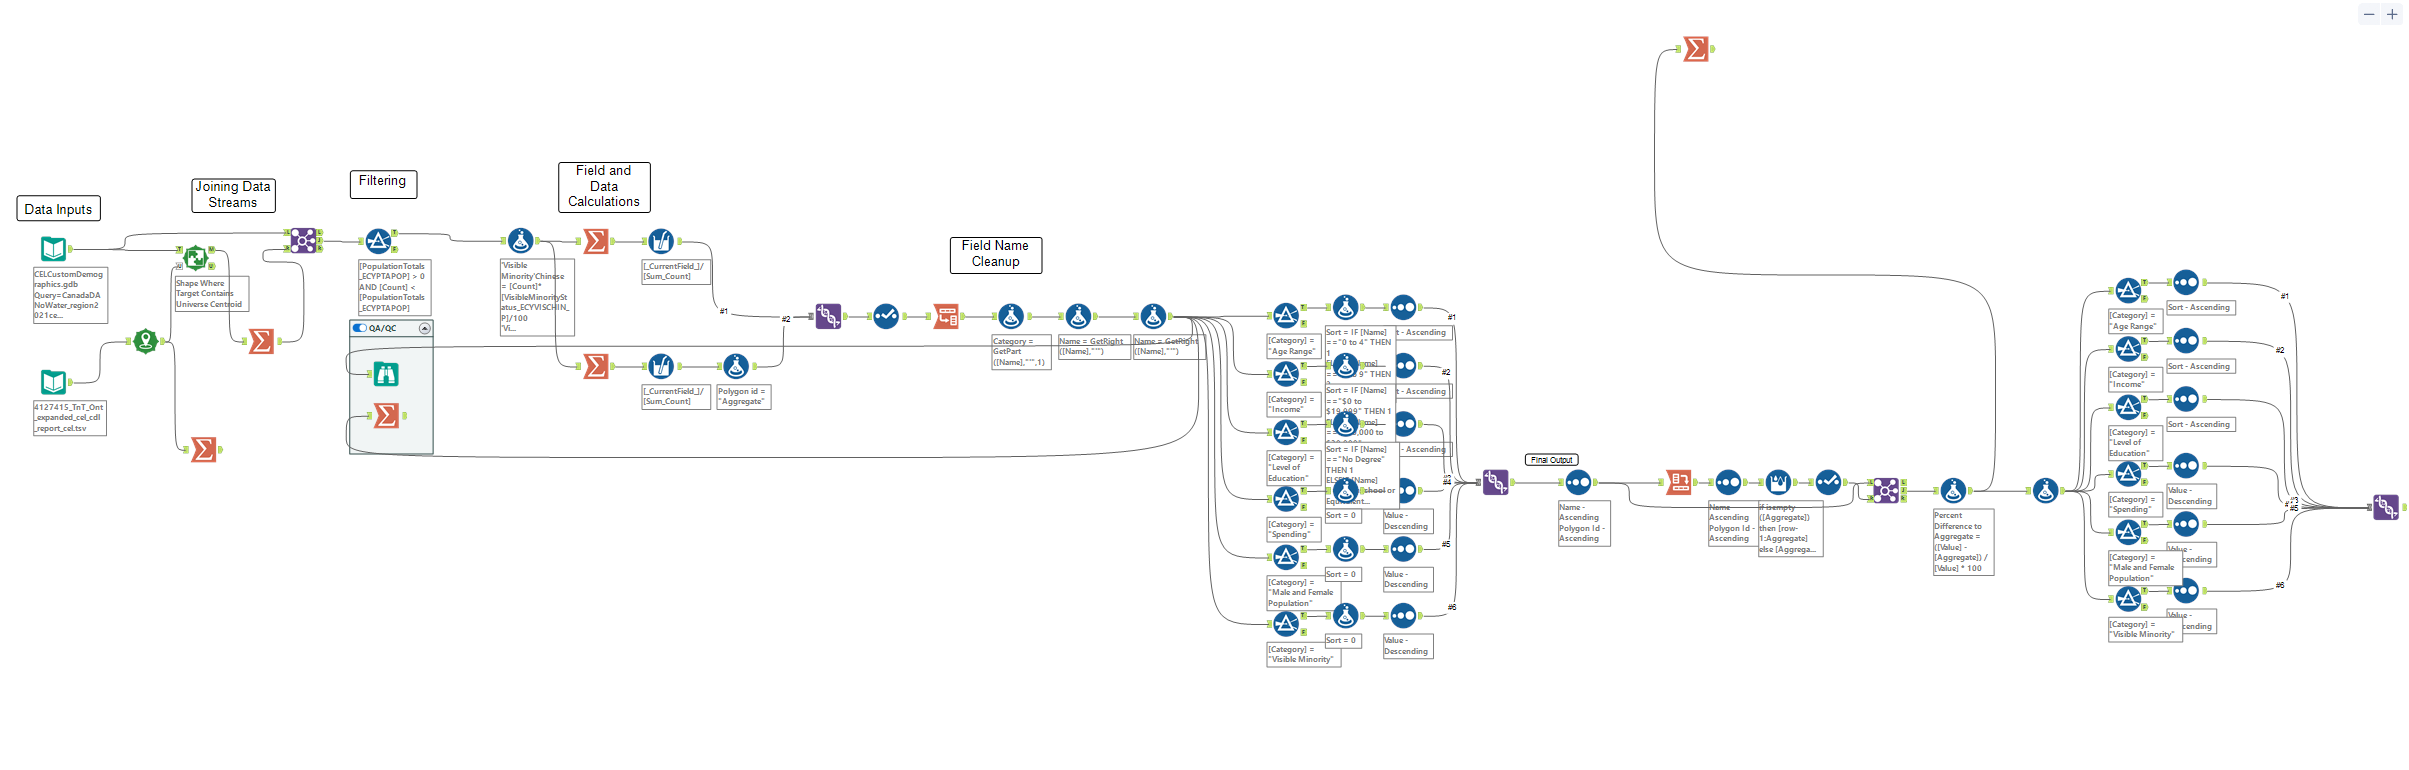
In addition to using Alteryx for smaller tasks as above, I was responsible for developing a comprehensive workflow to analyze customer demographics for an ethnic grocery store with a national presence. The workflow utilized massive mobile data, which included cellphone location information (both store visits and home locations) and demographic data per dissemination area. Our objective was to understand the customer base at each store. As an example, we could use this workflow to determine that customers at these stores primarily spend their money on recreation, or that a majority of customers have at least a high school level of education. Despite the challenges, I was pleased with the final output. The workflow involved counting common evening locations within each dissemination area, assumed to be cellphone home locations gathered at 6:00 PM on weekdays, and then deriving store-specific demographics based on this data. This finalized demographic information was used in conjunction with ArcGIS Dashboards to create useful dashboards for brokers and clients to use. Below is the final workflow created for this task (the picture is too zoomed out to see any specifics, but this example is just for reference).
Summary
Interning at CBRE not only taught me many aspects of the real estate world but also further revealed to me the vast reach that GIS and ESRI toolset have. Getting to use some of the ESRI products in ways I had not before was very exciting and offered many learning opportunities. Further, being fortunate enough to be sponsored by Naz Ali was instrumental in my learning throughout this BCIT program. Naz brought insight into so many aspects of GIS and I learned far more in the practicum than I had expected to. As I leave this program, I take with me a new perception towards the versatility of GIS and a further level of understanding of ESRI products. Thank you for your time, and I hope you enjoyed this blog.