
Urban Landcover Mapping: Using Deep Learning to Extract Impervious Surfaces
Introduction
Between 1950 and 2018, the global urban population grew from 0.8 billion to an estimated 4.2 billion. This unprecedented shift from rural to urban living is expected to continue, with projections estimating that by 2050, 68% of the global population will be living in concentrated urban areas (1). The growth of urban centers comes with significant changes to land cover, as forests and grasslands give way to artificial surfaces that prevent water infiltration, such as pavement, asphalt, and rooftops.
Quantifying the current and projected extent of impervious surface coverage is an important metric, as it is a tangible measure of urbanization and a key environmental indicator for many issues in the urban environment such as urban heat islands, surface runoff and flooding, and air pollution (2). Quantifying impervious surface coverage will allow cities to accurately address these urban environmental issues, and contribute to improved land use planning to build a more sustainable and resilient urban ecosystem.
Industry Practicum
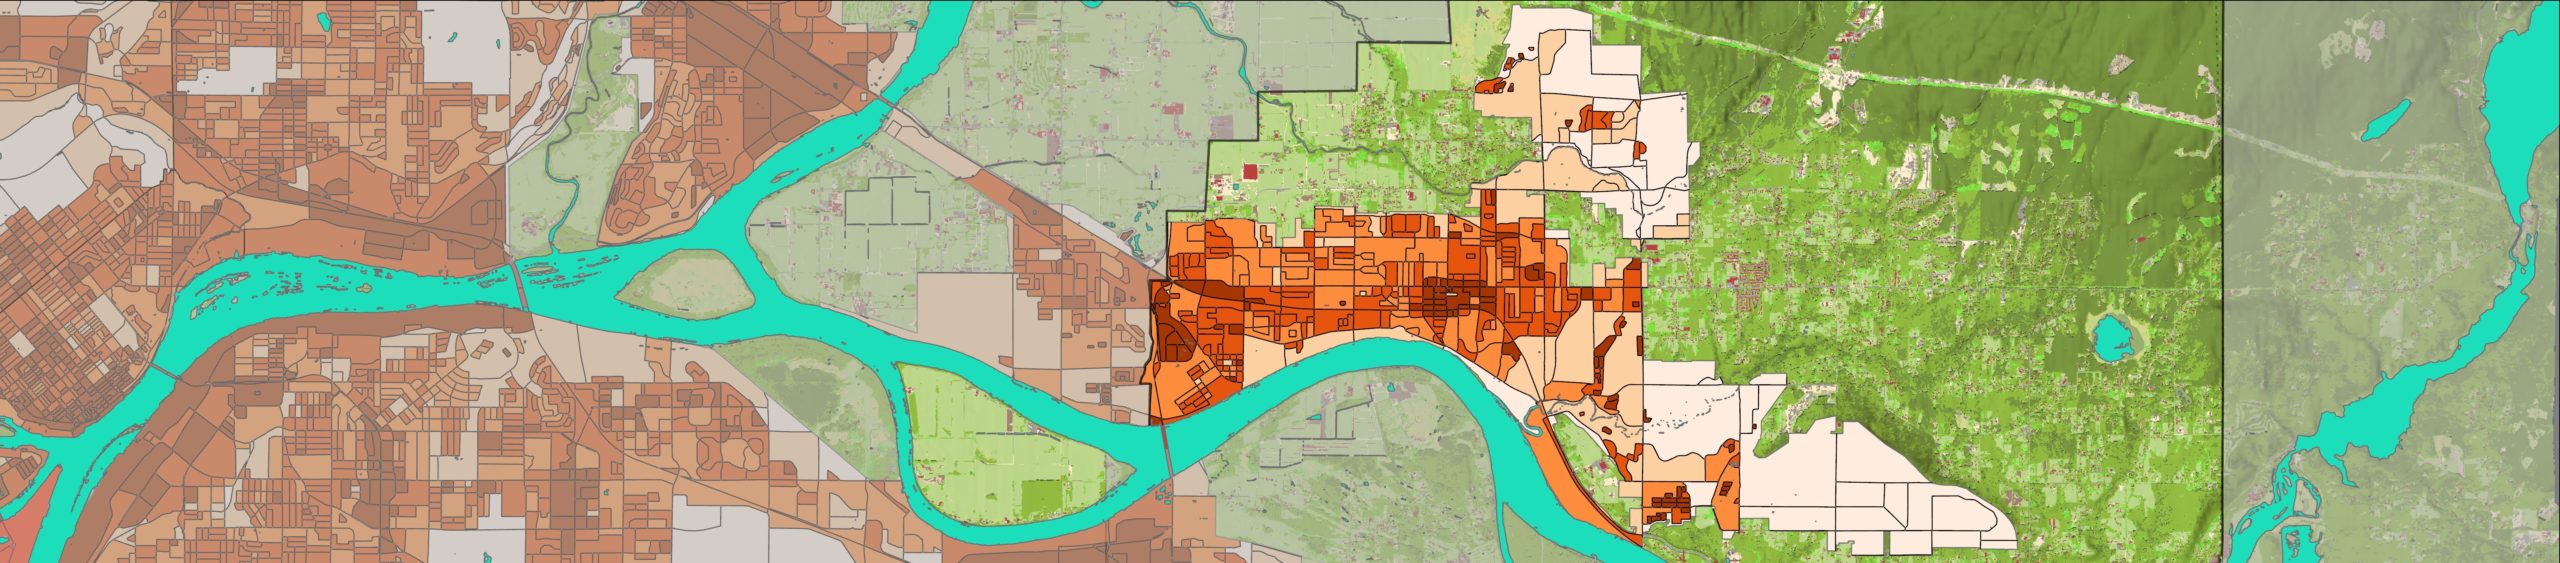
As part of the Advanced Diploma in Geographic Information Systems at BCIT, I have started working with the City of Maple Ridge to create a process for quantifying pervious/impervious surface coverage using Esri technology.
The City of Maple Ridge is located in the northeastern section of Greater Vancouver, on the unceded territory of the Kwantlen and Katzie First Nations People. Situated between the Fraser River to the South and the Agricultural Land Reserve (ALR) to the North and East, the city is constrained to a narrow development corridor. Despite this, Maple Ridge is one of the fastest growing communities in British Columbia with a 5-year growth rate of 8.2%, making current and future land use an essential component of city planning and decision making.
Urban landcover Mapping
Traditionally, reliable mapping of urban impervious surfaces would be acquired by ground surveys. These surveys were time-consuming and labor intensive, and the inability to supply real-time data restricted it’s use in city planning and development monitoring. The introduction of remote sensing technology offered a unique and innovative approach to mapping, interpreting, and monitoring urban landscapes. To date, landcover mapping for urban regions generally falls into two categories based on spatial resolution: a moderate-resolution approach and a very-high resolution approach.
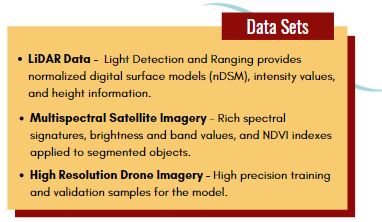
The very-high resolution approach utilizes multispectral and hyperspectral imagery with a spatial resolution <2m and more recently, airborne laser scanning like LiDAR. This approach is continuously improving, and data fusion is becoming commonplace, particularly of spectral, thematic, and 3-D structure data. It is this data fusion approach that will be used in conjunction with Esri’s machine learning technology to create an end-to-end land cover classification workflow utilizing WorldView-2 multispectral imagery and LiDAR derived data.
Machine Learning and AI
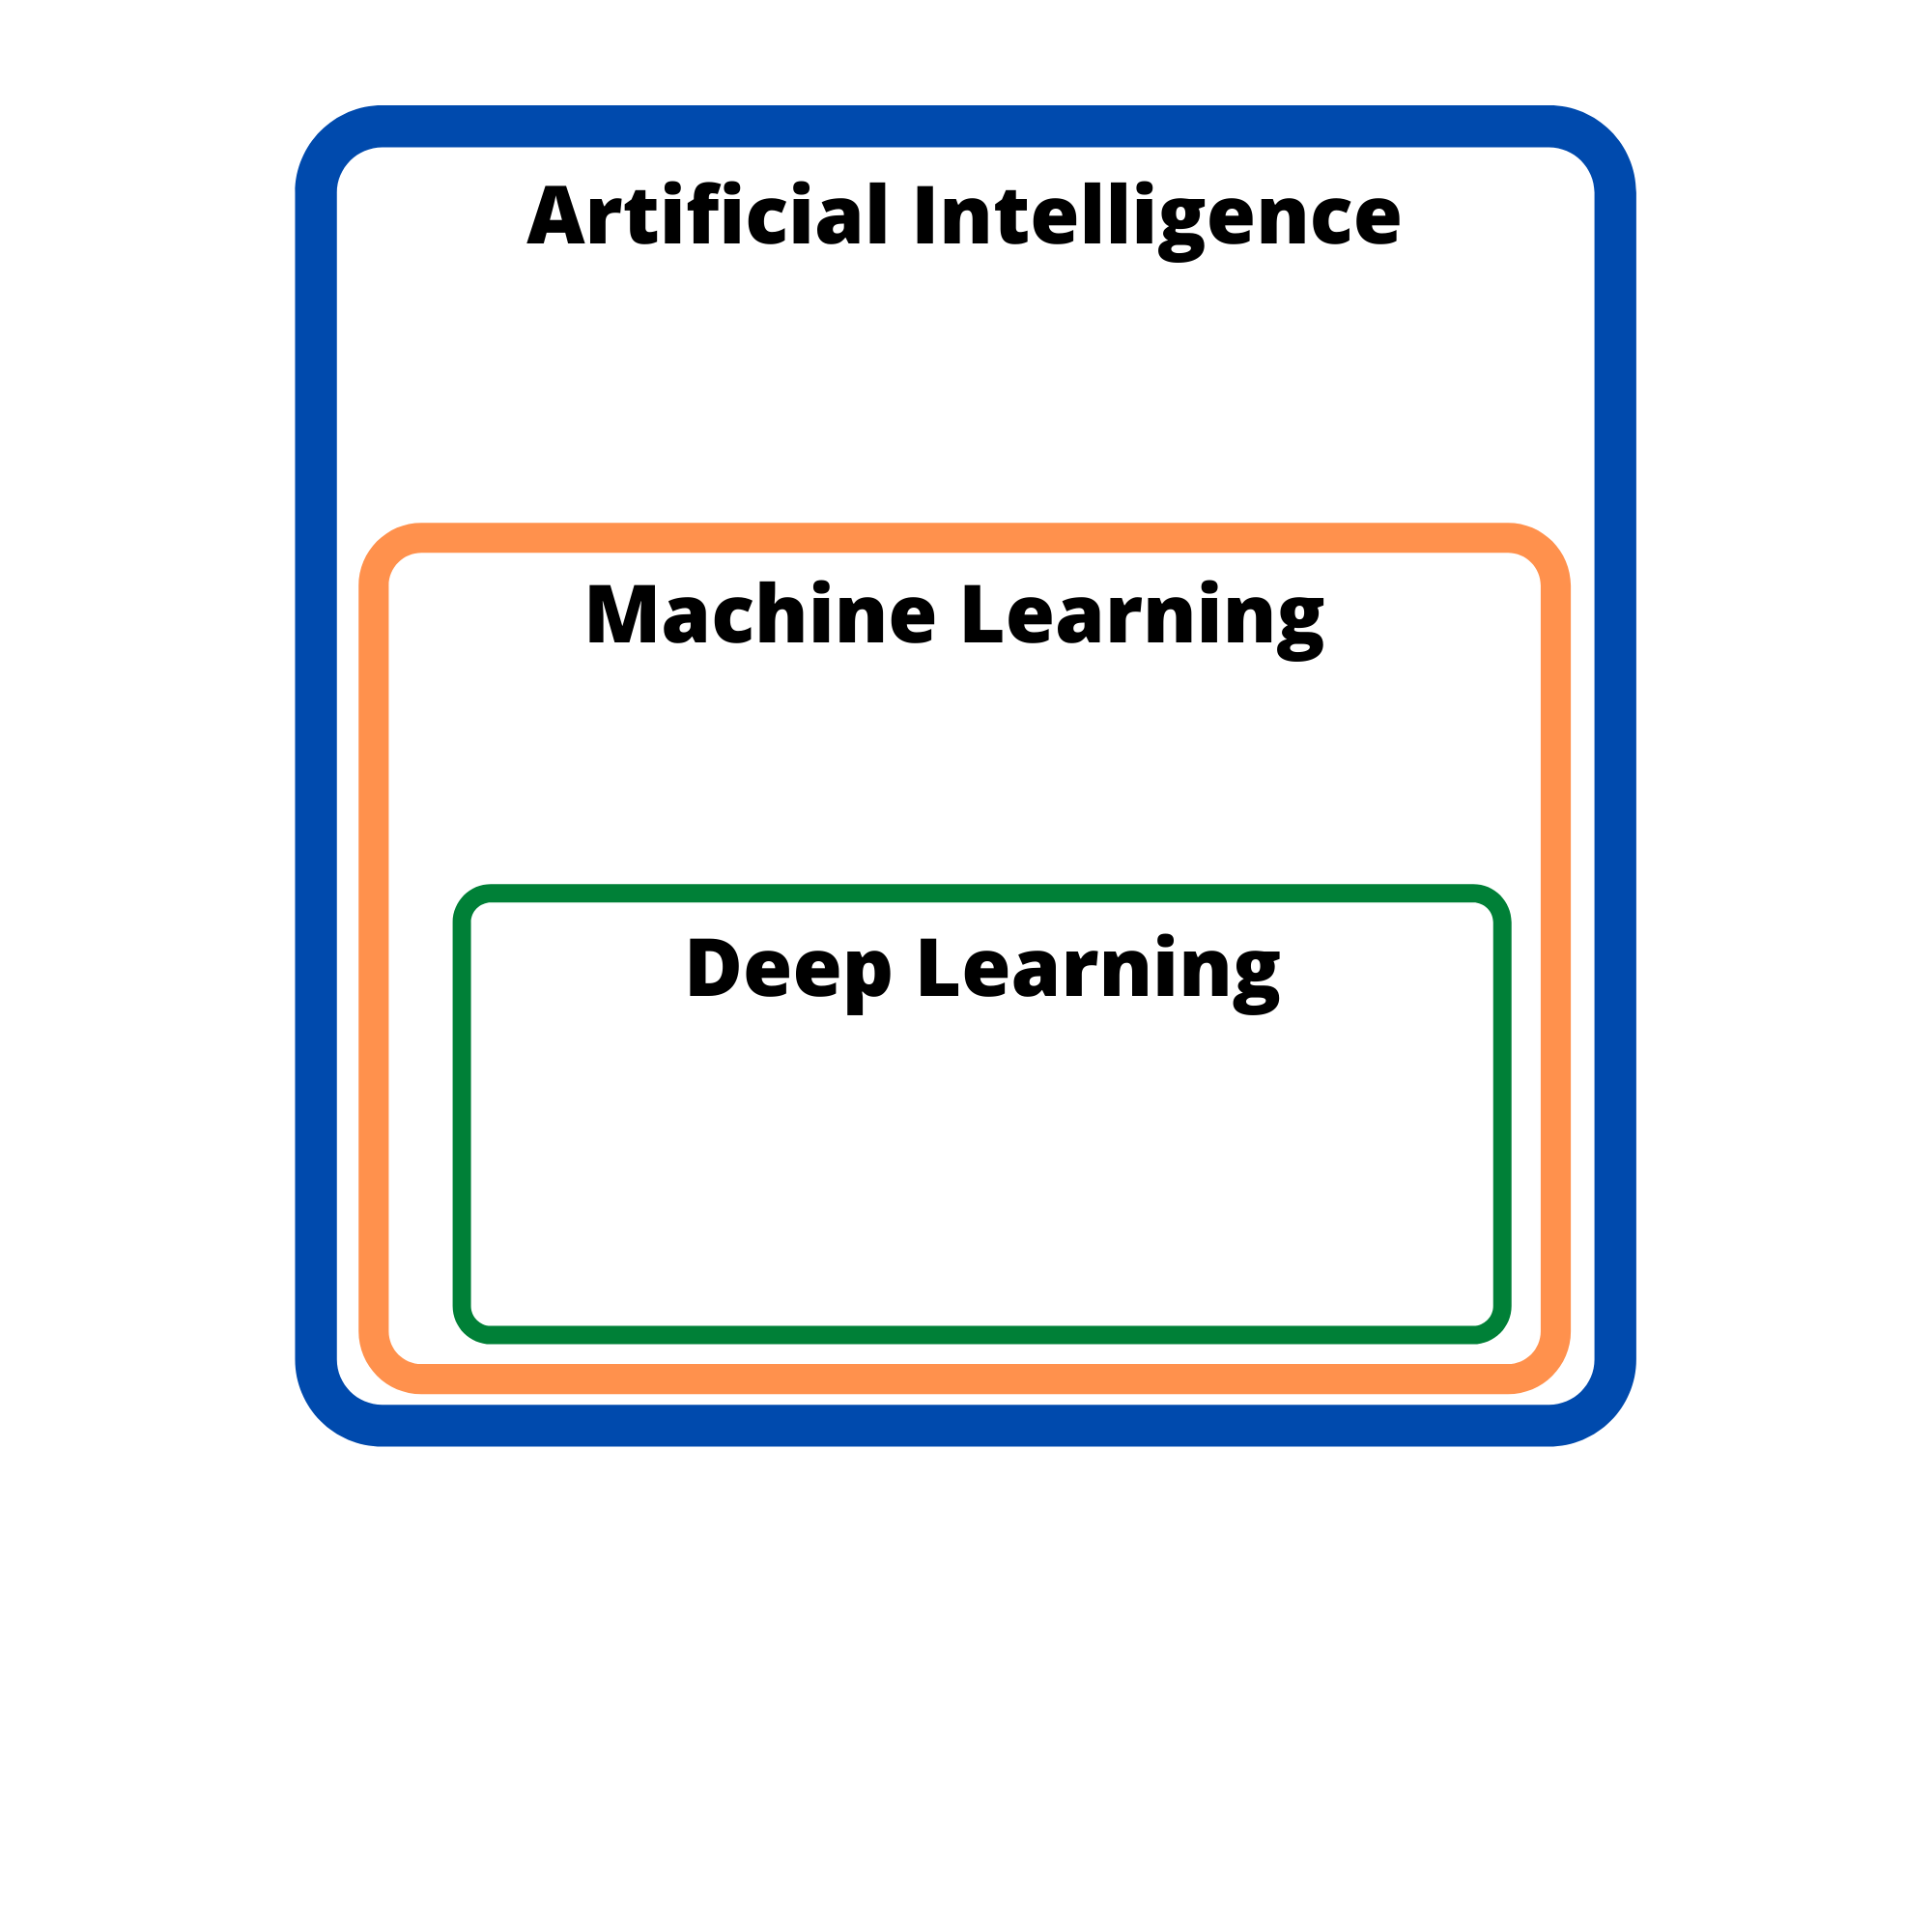
Esri has provided machine learning and AI technology within ArcGIS in the past to model spatial relationships, make data-driven decisions, and perform image classification. Recently however, they have been developing tools and workflows to harness a subset of machine learning, deep learning, which utilizes convolutional neural network (CNN) algorithms to train computers to do tasks and solve problems.
Esri allows users to develop and train their own deep learning models, or to use Esri’s pretrained models. Esri currently offers 27 different pretrained deep learning models on the ArcGIS Living Atlas. These models are pretrained on large volumes of data, and help accelerate workflows designed specifically for image feature extraction, land-cover classification, and detecting objects.
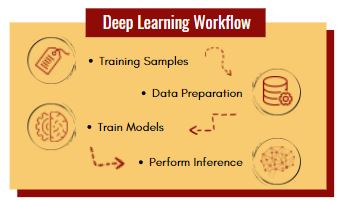
As the practicum is still in progress, the model is constantly being developed and fine tuned for more precise and accurate deliverables. The second blog post in this series will explore the nitty gritty of developing a deep learning model for land use classification and extracting impervious surfaces using Esri technology, and explain in depth the technical components, required datasets, detailed workflow, and common mistakes along the way.
References
(1) United Nations, Department of Economic and Social Affairs, Population Division. World Urbanization Prospects: The 2018 Revision (United Nations, Department of Economic and Social Affairs, Population Division, 2018).
(2) Luo, H., et al., 2018. An Improved Method for Impervious Surface Mapping Incorporating LiDAR Data and High-Resolution Imagery at Different Acquisition Times. Remote Sensing, 10 (9), 1-27.