
Pavement Marking Inventory using GIS and Computer Vision – Part I
Pavement markings are essential components of road infrastructure and play a pivotal role in road traffic safety. Through the usage of lines, symbols, colours, and text, they provide visual guidance and convey a range of information related to navigation and safety to drivers and pedestrians. Good road marking is a cost-effective way to reduce collisions and save lives, and the average road user often does not realize just how much thought, effort, and resources are needed to design, paint, and maintain them behind the scenes.
Over the past few months I have been working with the City of Surrey on their pavement marking asset inventory pilot project for my industry practicum at BCIT. With a population of 580,000, Surrey is one of the largest and fastest growing municipalities in the Lower Mainland. There are many major transportation and housing development projects happening in Surrey at the moment, and keeping track of the city’s transportation assets is a big task. Having a reliable and up-to-date comprehensive spatial data inventory of the markings would be very useful. It would allow us to answer questions like “what are the most common types of crosswalks in Surrey?” or “How frequently and when should we expect to repair the bicycle markings on this street next?”
The City would like to conduct a full inventory count of all of the existing pavement markings on City owned and maintained lands, and this includes but is not limited to roadways, parks, and city operated parking facilities. There are several ways we could approach this: we could drive through each street with a GPS to count and map them all (not recommended for various reasons, including cost and efficiency), or we could manually digitize them from aerial and/or satellite imagery. However, considering how many markings are on just one street, even the latter approach would be very labour-intensive and tedious to populate the data at a centimeter-level for the entire city. Not to mention, with the constant ongoing road work and frequent wear-and-tear, the marking assets are constantly changing, and it would be difficult to always keep the data current from year-to-year.
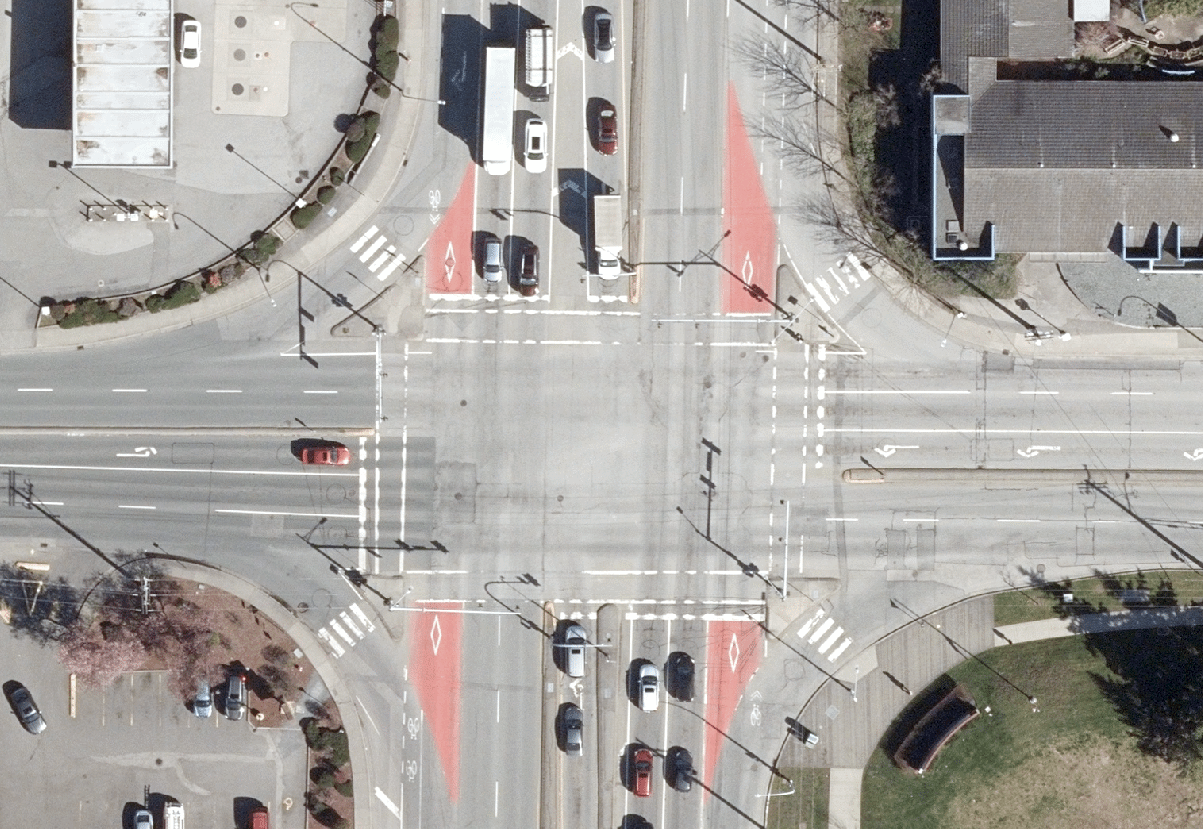
This is where we considered this to be an opportunity to use computer vision and deep learning to automate the extraction of pavement markings from high-resolution aerial orthophotos. These photos are generally captured at much higher resolution than most satellite imagery, and small objects like pavement markings are often easily discernable. Since Surrey already collects high-res orthophotos every year, we can use them to create marking location and attribute information through the use of machine learning. We have decided to complete this deep learning pilot project using ArcGIS Pro Image Analyst.
Where Computer Vision Meets GIS
The recent explosion in computational power and big data has opened up a wealth of new possibilities that we could only dream of before. Most of us probably have heard of artificial intelligence and machine learning already – so what are they? Essentially, they are about teaching computers to automate and perform tasks that would normally require some degree of human intelligence by feeding them training data. The trained computer model will iteratively learn, and make adjustments to improve results with each iteration. Many GIS processes such as classification, clustering and geographically weighted regression, already rely on machine learning.
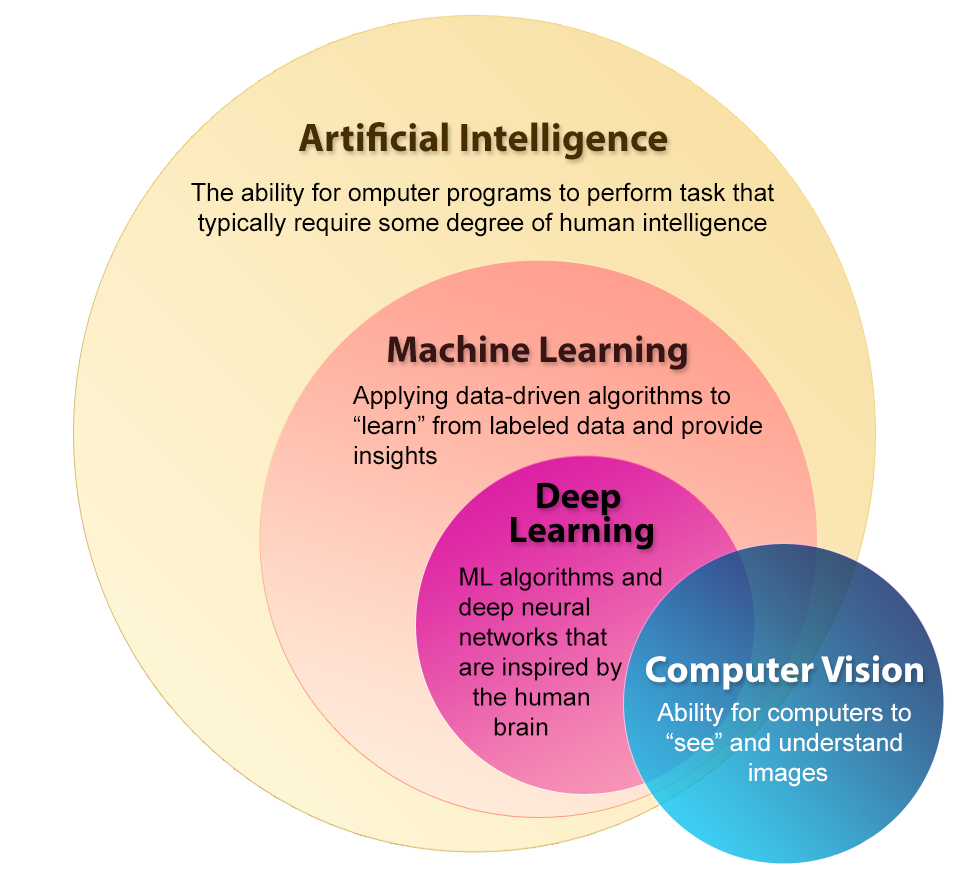
Deep learning is a subset of machine learning concerned with algorithms that are inspired by the human brain neural networks. In general, deep learning requires much less human assistance when compared to machine learning. The related domain of computer vision, referring to the ability for computers to see and understand images, is particularly useful in GIS, as massive amounts of raster data such as aerial and satellite imagery are routinely being produced. It is not feasible for humans to analyze such large amounts of data through traditional and manual means, thus the need for automation has risen.
ArcGIS Image Analyst
Image Analyst is a relatively new extension to ArcGIS and it has capabilities to perform advanced analyses such as image classification, change detection and stereo-mapping. It also supports motion imagery/video.
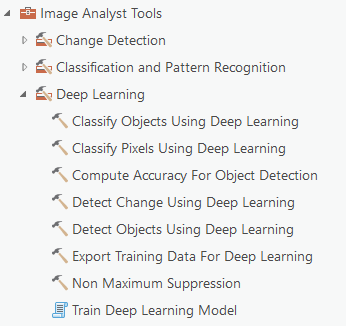
For our project we will be focusing on the Deep Learning toolsets within Image Analyst. In general, the deep learning workflow consists of creating the labeled training data, feeding the sample data to train the model, and then using the trained model to run inferencing and detect the relevant objects in the study area. The Image Analyst toolbox includes tools to perform all the above processes as well as computing accuracy assessment.
In our case, we are using the Detect Objects Using Deep Learning tool to extract pavement markings from the City’s orthophotographs. After many weeks of trial-and-error with various frameworks and parameters and tweaking our models, we have been getting some very promising results:
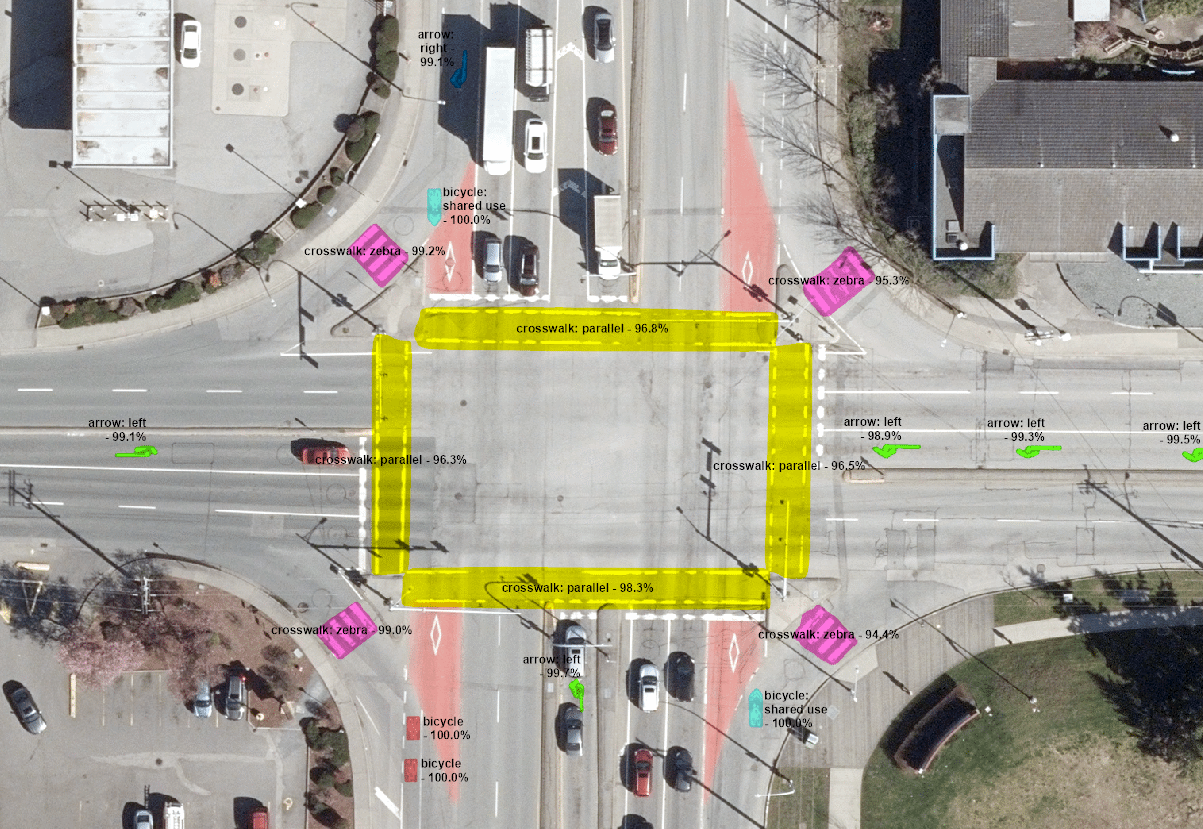
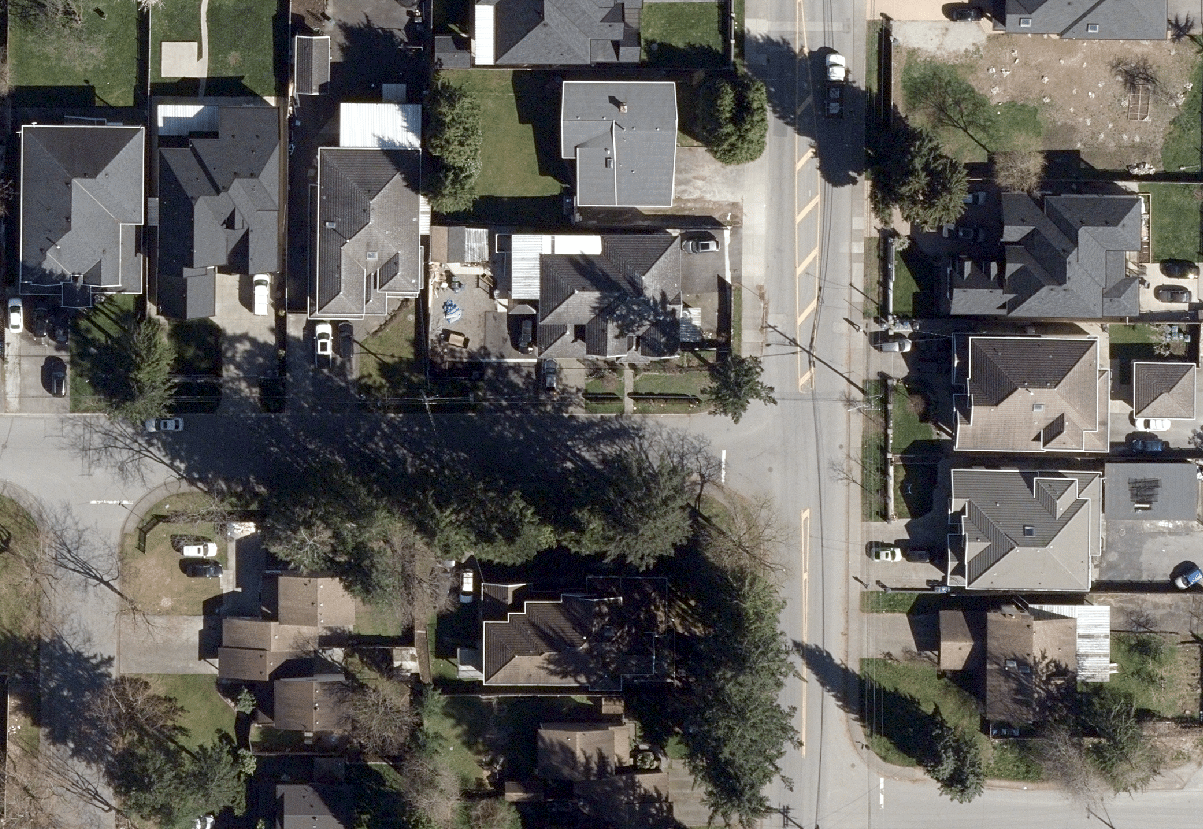
In addition to the markings shown in the above figure, we are starting to train the model to detect other objects such as gore areas, transverse stop bars, and high occupancy vehicle lane diamond symbols as well. Here is another screenshot of a residential area in Surrey, where the model successfully picked up one of the gore areas (median) and all the stop bars in the neighbourhood:

The project is in progress and each week we are still discovering new ways to improve our detection model. Stayed tuned for Part II of this blog series where we will dive deeper into the technical components: the deep learning workflow, the step-by-step process for training the model, and how we overcame the many hurdles and challenges along the way.