 Creating Customized Bar Graphs with Limits in ArcGIS Online Pop-Ups
Posted 5 years ago
By Liam Gowan
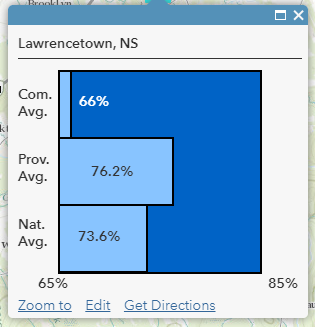
Creating column and bar graphs in ArcGIS Online is an easy way to show numerical data to users in pop-ups, but what it lacks is the ability to customize colours, say which column/bar corresponds to which data, and set limits that correspond more appropriately to the data presented. Why does this matter? Lets say that you […]
Read More
 Partially Scripted Way to Show Images Obtained from Collector in ArcGIS Online Pop-ups
Posted 5 years ago
By Liam Gowan
So, you’ve just used Collector to collect data, including pictures, and now you want to display those images in ArcGIS Online pop-ups for each data point, but you keep getting something that looks like this? But instead want your picture displayed in the pop-up, like this? Read on for one solution that does not involve […]
Read More
 COGS First Semester Overview for Non-Geomatics Grads
Posted 6 years ago
By Liam Gowan
If you had asked me in January 2018, when I was just entering my final semester of a computer science degree and never hearing of GIS, if I thought I’d ever be putting my CS knowledge to anything involving geography, I probably would have said “Why? Google Maps and GPS’s already exist, there’s nothing else […]
Read More
 COG(S)itation on the Esri Canada Fredericton User Conference 2018
Posted 6 years ago
By Liam Gowan
Greetings everyone, My name is Liam Gowan and I am enrolled in the Advanced Diploma in Geographic Sciences (and will be enrolling in the GIS concentration) at the Centre of Geographic Sciences, NSCC. I am one of the six ECCE Student Associates from COGS, and I am writing to reflect on my experience of the […]
Read More
 Creating Customized Bar Graphs with Limits in ArcGIS Online Pop-Ups


