
Analyzing the Distribution of Houses and Condominiums of Vancouver Airbnb
This blog post is about my first spatial data science assignment. The purpose of this assignment was to map out the location the Vancouver Airbnb and analyze the various trends of the properties, specifically the House and Condominiums. I was given a non-spatial csv file that contained the ID, Property Type (House or Condominium), Room Type, Bedroom Numbers, Price, and Review Scores of 5,618 properties.
The very first thing I did was visualize the data using ArcGIS Pro. I mapped the Vancouver Airbnb properties using shapefile that I was provided, then later exported as another csv file with the respective longitude and latitude values included as attributes. I also applied a natural break level of measurement to the price category of the Vancouver Airbnb and divided them into three classes, and included this as an attribute with the data points that identified each as falling within low, middle, and high price ranges.
Then, using R and R Studio, I created a scatterplot of the Vancouver Airbnb properties. I added a point for mean centre and weighted mean centre of the whole dataset and for the House and Condominium points separately. While the mean centre shows a point that is the average location of all properties in the Vancouver Airbnb, the weighted mean centre of the dataset is based on the price variable, producing a point representing the average centre of the dataset with the influence of price. The figure below shows the scatterplot I ended up with.
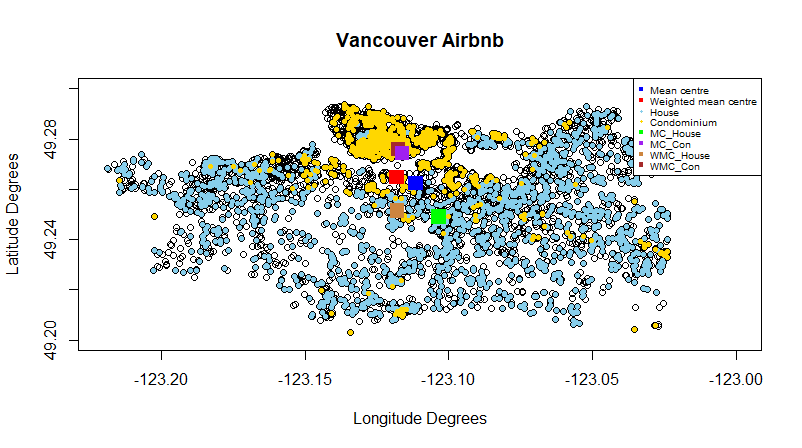
Based on the scatterplot, we can see that the Vancouver Airbnb properties are dispersed all across Vancouver. More specifically, Houses are dispersed across Vancouver while most of the Condominiums are in the northern region of Vancouver with a few scattered in the South and Southeast regions. Compared to the Southeast, there seems to be more Condominiums in the North and slight Northwest region while the biggest cluster is in the North. On the other hand, Houses appear to be more clustered in the West compared to the East.
The mean centre point of all the Vancouver Airbnb properties has longitude and latitude values of -123.1114° and 49.2622° respectively, and it is located a little North of the centre of Vancouver. Similarly, the mean centre of Houses is (-123.1034°, 49.249°) while the mean centre of Condominiums is (-123.116°, 49.2743°). The mean centre of the Houses is in the centre of Vancouver, while the mean centre of the Condominiums is in the North.
As for the weighted mean centre, the whole dataset’s weighted mean centre is (-123.1181°, 49.264°). The House’s weighted mean centre is located at (-123.1179°, 49.2513°), while Condominium’s weighted mean centre is (-123.1175°, 49.2759°). When weighted by price, the mean centre of for Houses is pulled to the west. On the other hand, the weighted mean centre of the Condominiums is very slightly pulled the North. Finally, the weighted mean centre of the whole dataset is shifted slightly Northwest of the unweighted mean.
Thus, from the mean centre and weighted mean centre results, we can see that the North and slight Northwest regions are where more houses and condominiums are located. Also, we notice that the pricier properties are located in the Northern region of Vancouver. This would be a result of the more expensive Condominiums that are located in the North of Vancouver, and more expensive Houses located towards the centre.
Although this assignment was mainly focused on basic spatial statistics using R and R Studio, it’s worth noting that the same analysis could be done directly in ArcGIS Pro (e.g., using the Mean Center analysis tool). In addition, I’ve learned that there is an R-ArcGIS extension available, which could be useful to transfer data more seamlessly between R and ArcGIS.