
A Geographic Information Systems (GIS) Summer Student in the Department of Facility Services at McMaster University
This summer I had the great pleasure of being a part of a great team and taking on an amazing opportunity offered by Facility Services at McMaster University as a Geographic Information Systems (GIS) Summer Student for a 4-month work term. This opportunity was brought to my attention by my professor Patrick DeLuca who taught the Advanced Raster GIS course that I took recently. He had also provided me with guidance, support and equipment to work through this project.
The goal of this role was to lead a pilot project for the department by taking CAD data (in DWG format) that originally came from a physical copy booklet of drawings that are older than I am, and converting them into useful spatial data that can be edited and have attributes applied to them in ArcGIS Pro. In other words, I had to use our campus CAD drawings and turn them into a fully spatial campus GIS dataset that can be viewed and used by all individuals who have access privileges. My responsibilities for this task were split into two categories of work; technical and fieldwork.
ArcGIS Pro (Technical)
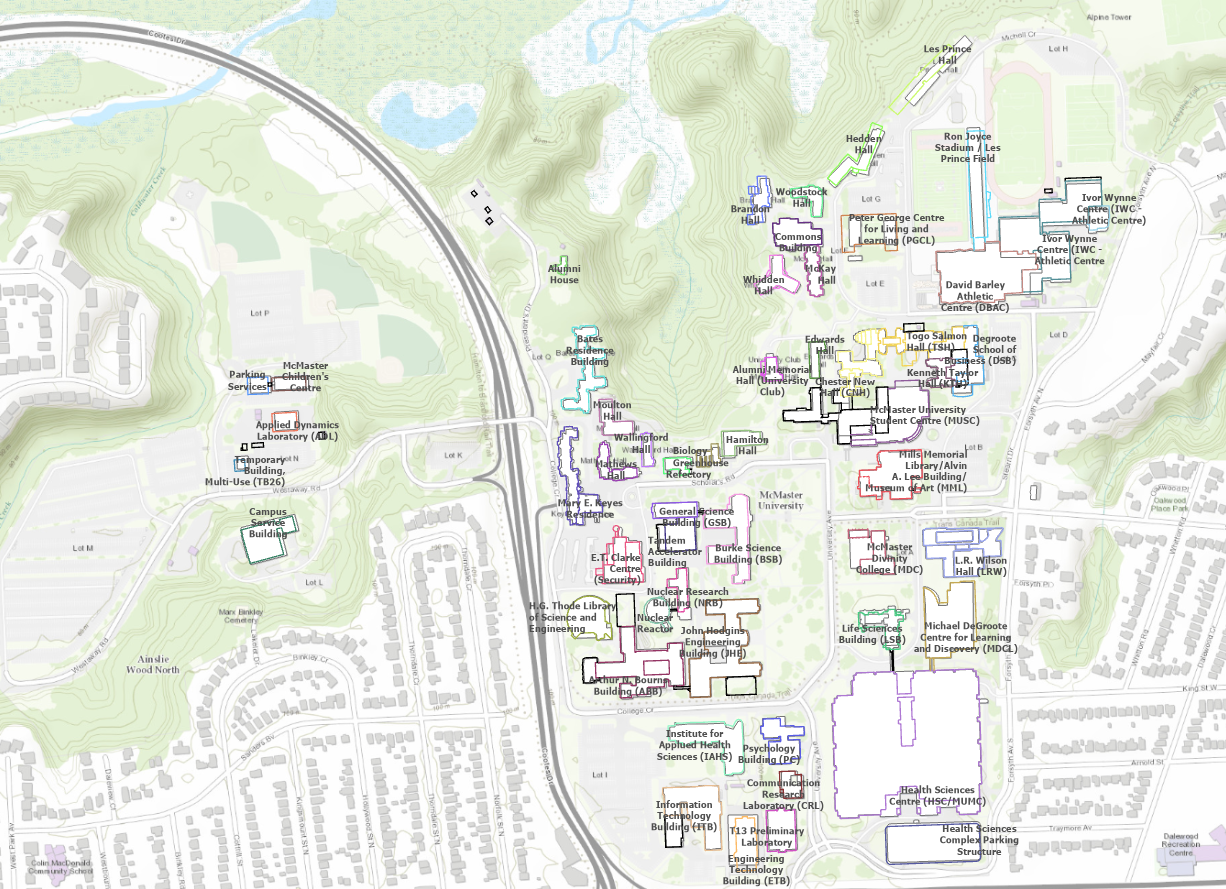
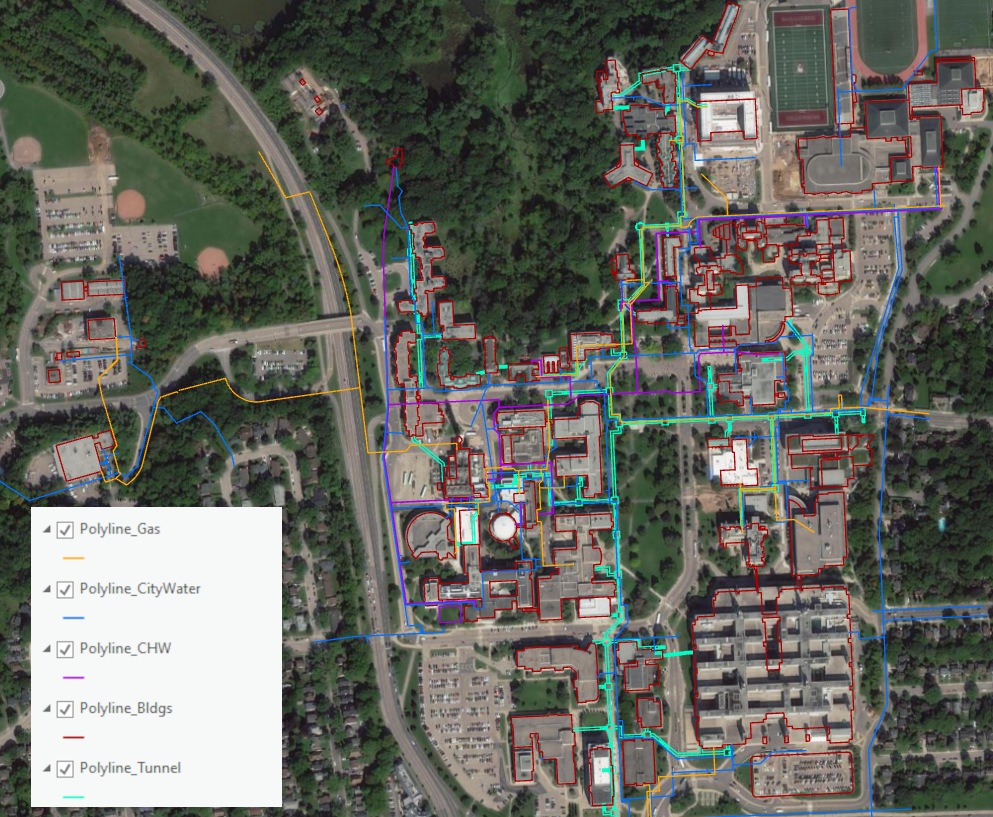
To begin, the technical side involved a lot of work with building GIS data layers for campus features and learning to import CAD data into ArcGIS Pro, and even ArcMap at times, and experimenting with the data in the early stages. Tunnels, Buildings, Natural Gas lines, CHW (Chilled Water) lines, and Domestic waterlines were the main layers I was working with. It must be noted that when CAD data are imported into ArcGIS Pro, it will come in the form of a feature layer, and the drawing’s origin coordinate will be located at (0,0,0), which is not related to the actual geographic location of McMaster University in the city of Hamilton, Ontario. This is because the CAD data did not have a known spatial reference. Therefore, these feature layers had to be georeferenced to make sure the features are positioned in the correct geographic location. To do this I started by working with the Buildings layer because having that correctly georeferenced first would help me with georeferencing the rest of the layers, which could easily be overlaid and compared with reference points on the Building layer. But I wasn’t aware that this task would involve more than just a simple georeferencing exercise to complete the alignment.
The very first attempt of mine started with the use of Bookmarks on the Map tab, by capturing bookmarks on campus and the CAD drawing at its (0,0,0) coordinate location. This helped me navigate easily between the geographic location of the McMaster campus in the basemap and the location of the CAD drawings located at their unprojected coordinates. Then, I used the CAD Layer tools in ArcGIS Pro to georeference features on the Buildings layer, where I assigned two control points to associate locations in the unprojected CAD drawings to the McMaster campus in the basemap. Then I moved and rotated the CAD layer to match the campus. However, it was still unaligned in some areas which led to my conclusion that the drawings done on AutoCAD might be off. I sent this layer over to Patrick DeLuca, and he agreed. It appeared as though the buildings themselves were split between a polylines group and a polygon group of features and there appeared to be significant precision issues in some of the building polyline records. For example, Thode Library, which is easily identifiable on campus due to its unique shape, had a strange shape in the CAD data that was different from can be seen in an aerial photo.
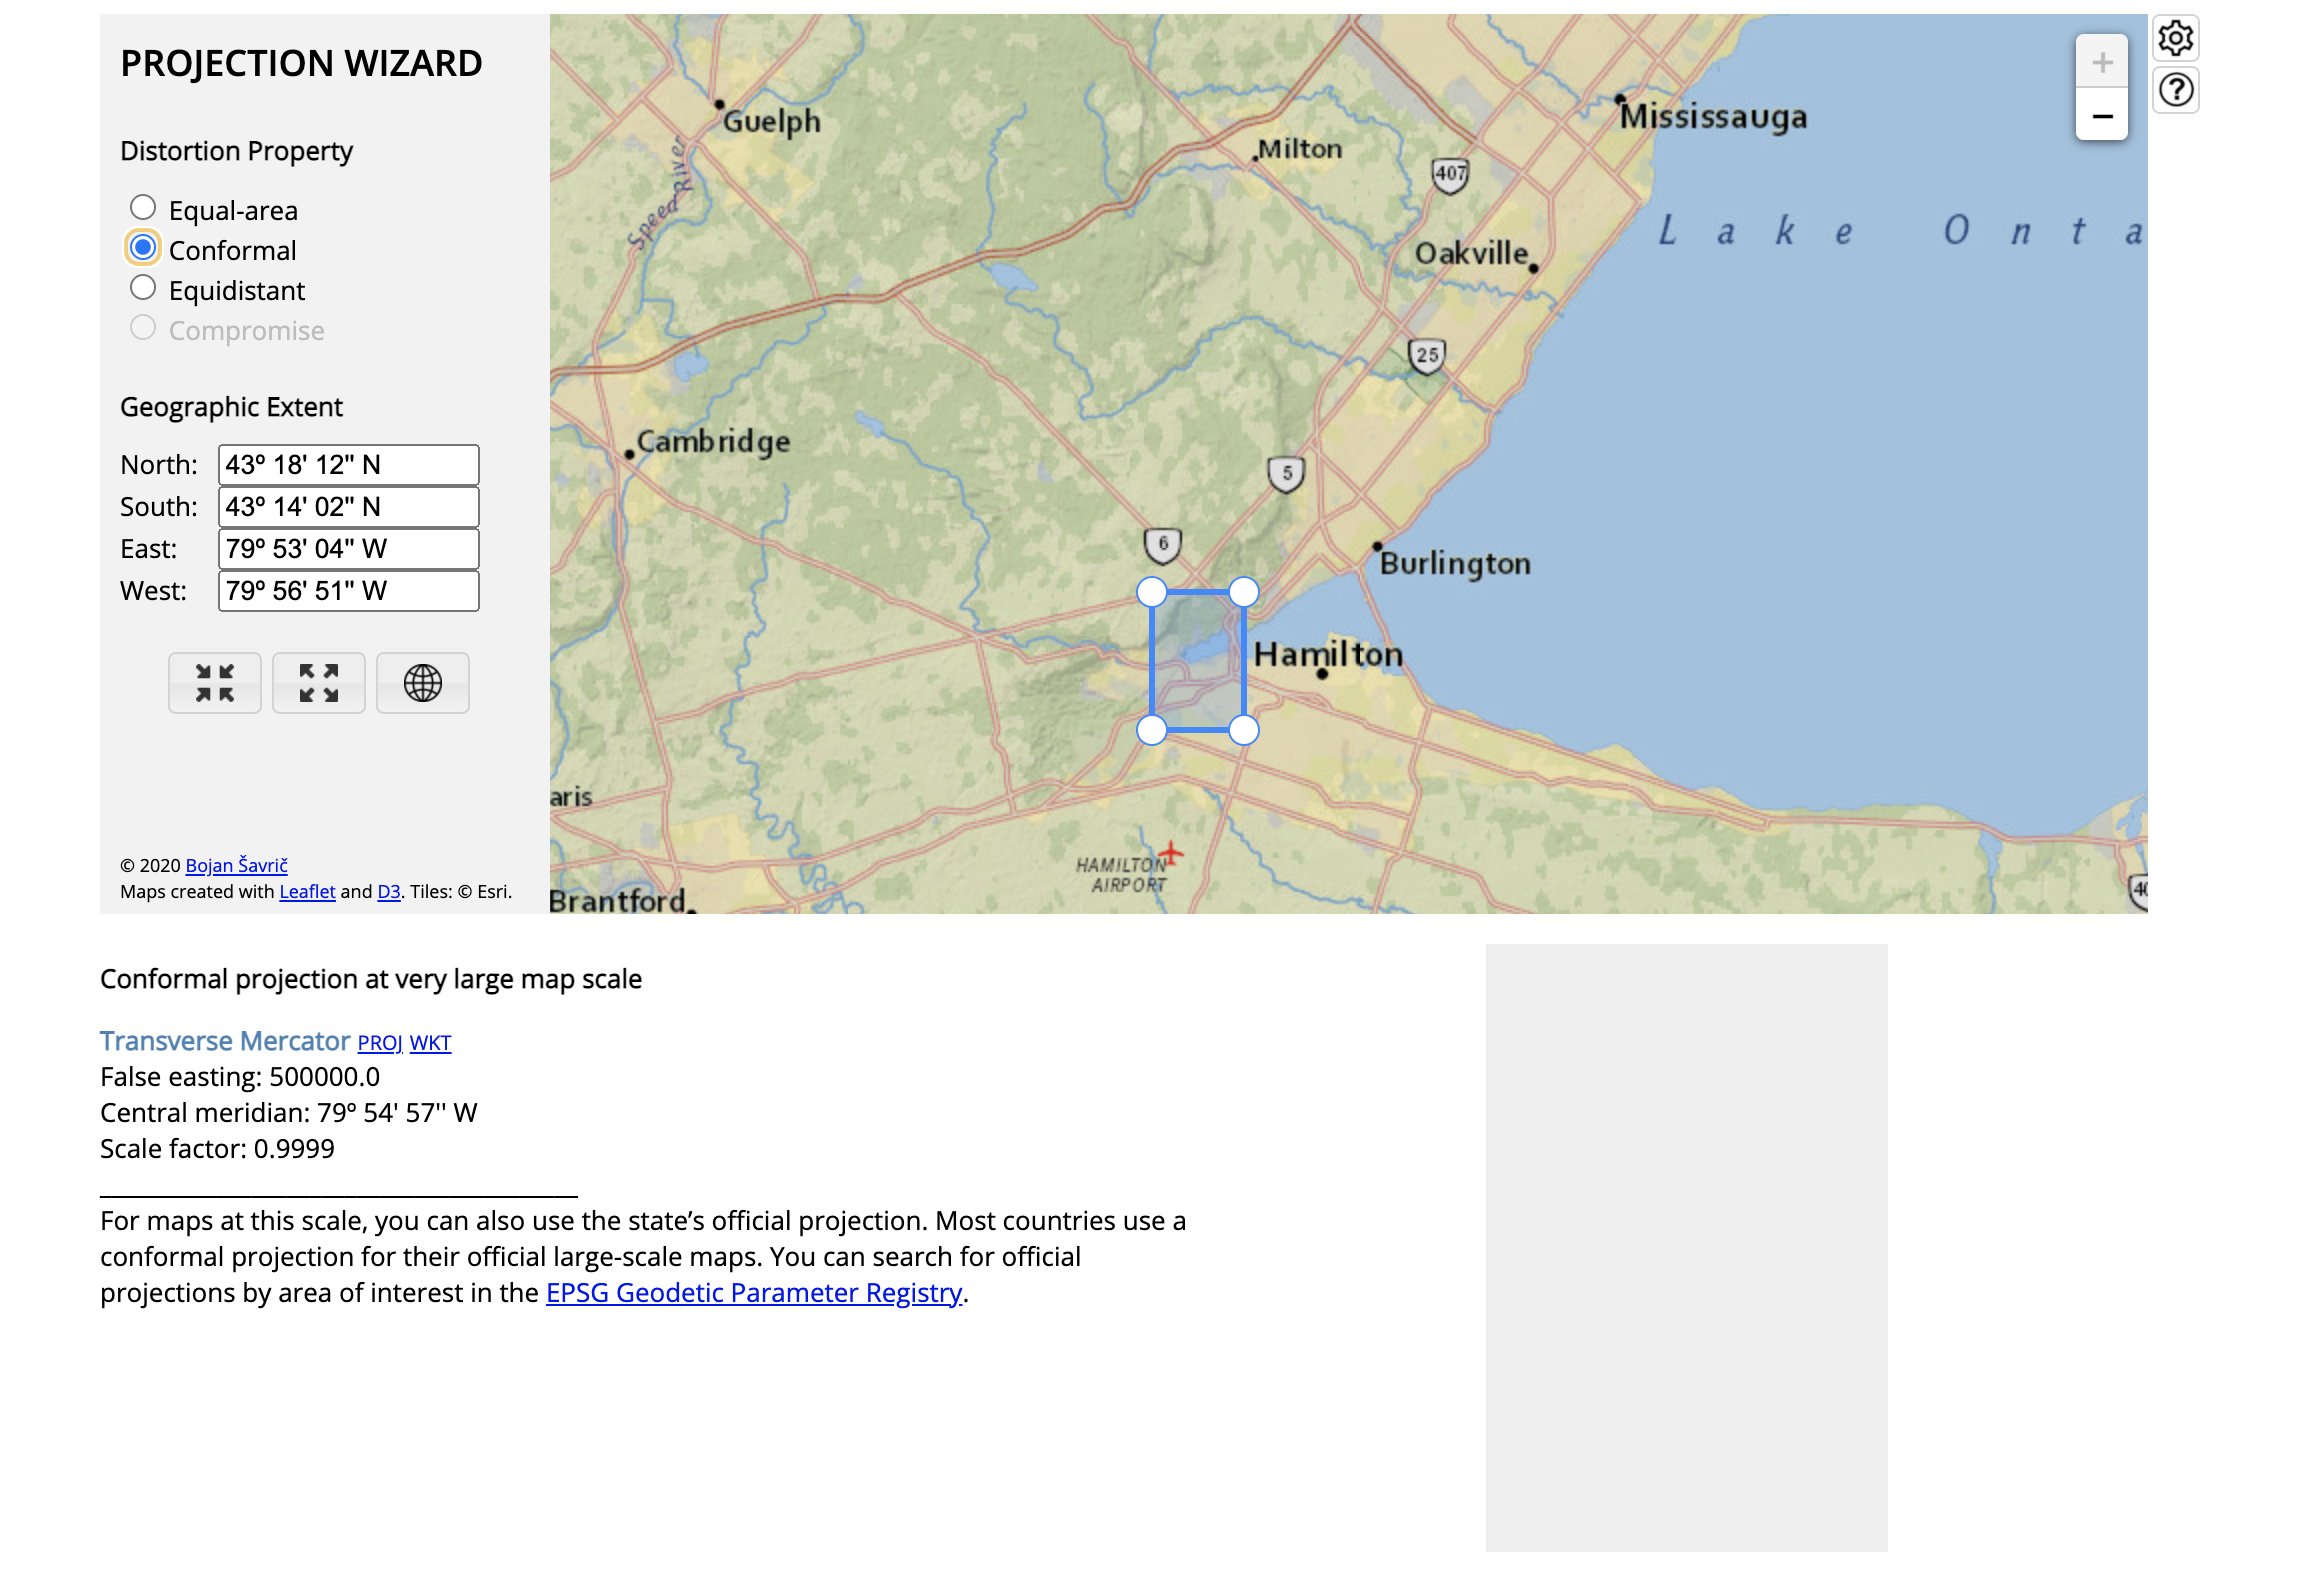
For part of this exercise, I learned how to make a custom projection we named the McMaster Modified Transverse Mercator. The first step was to obtain the central meridian value using projectionwizard.org. The central meridian cuts through campus. An attempt was made to redo the steps that I had mentioned earlier with my new projection, but unfortunately this did not help. I later changed the coordinate system of the map and also modified the projected coordinate system using WGS 1984 Zone 17N and entered the central meridian value for greater accuracy. This new coordinate system was named McMaster Modified Transverse Mercator UTM.
Once these steps were completed, I projected all the CAD drawings layers and georeferenced them over campus from the Topographic basemap. This was followed by a long process of cleaning up the attributes, applying symbology, and assigning labels. I was later informed that since the layer still didn’t fully align, they would be redrawn in AutoCAD as isolated features for me to work on all over again.
There was a lot of back and forth work with the CAD data, but once the drawings were completed the final steps of fixing these layers came from the assistance of the ESRI Canada Community Maps team who sent a new campus base layer (building subset polygon) for me to work off of by applying a spatial adjustment to match the CAD data to the building subset polygon.
Field work
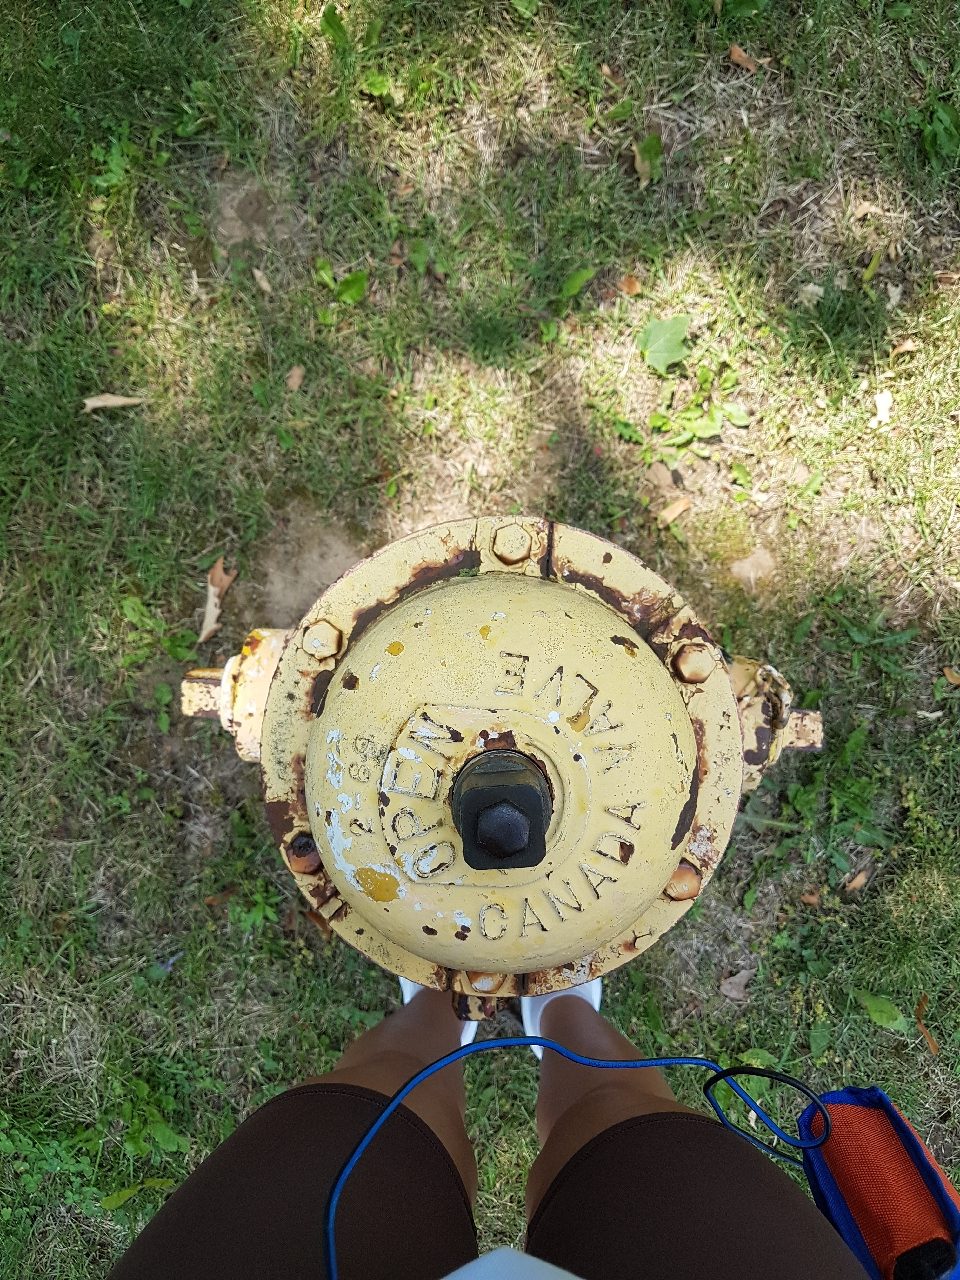
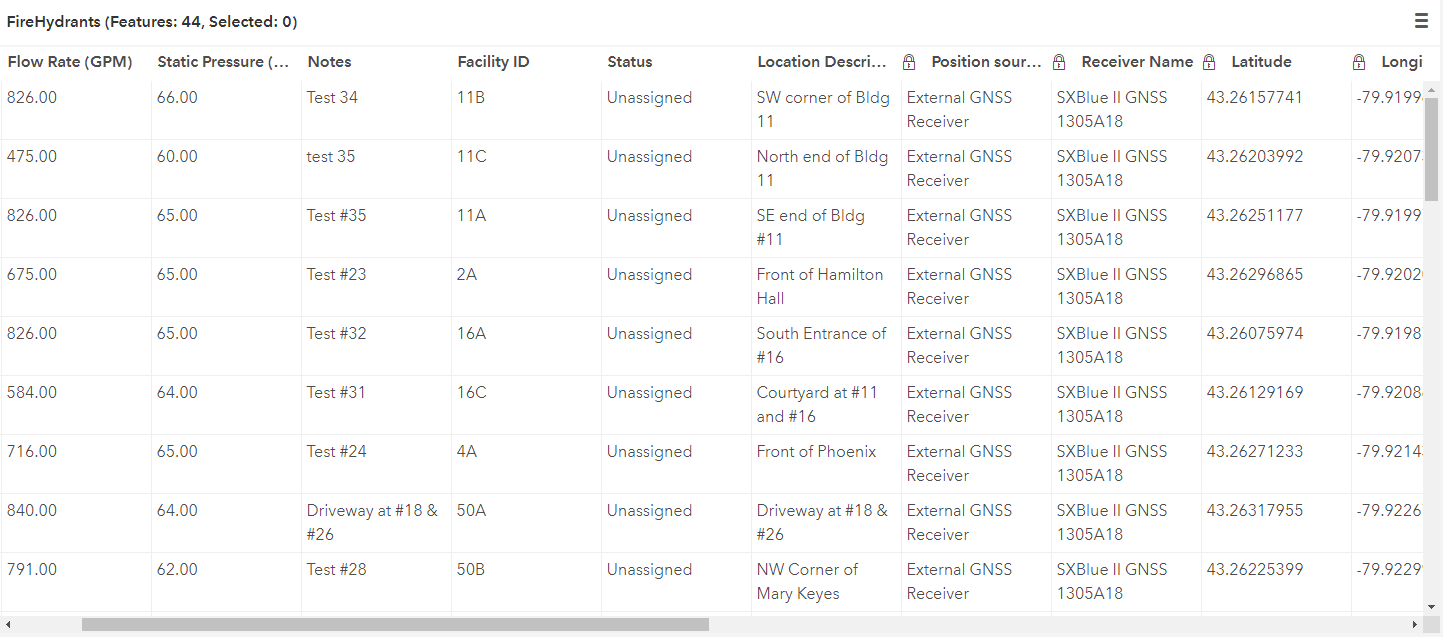
My second responsibility readily filled up the other half of my work term. I was given the task of collecting data with the use of the ESRI FieldMaps application. The features of focus for this work term were fire hydrants and their corresponding valves. The hydrant layer will provide Facility Services with information regarding their private hydrants. Information collected included longitude and latitude coordinates within the campus, Static Pressure, Nozzle Size, Pitot Reading, Flow (GPM), and Residual Pressure. As well as information regarding the surroundings of the hydrants such as Facility ID (ex: 11B) and Location Description (ex: SW corner of Bldg #11). An image of the hydrants is captured after every inspection, with the purpose of uploading its data and information on the ArcGIS software for display and analysis for future inspections.
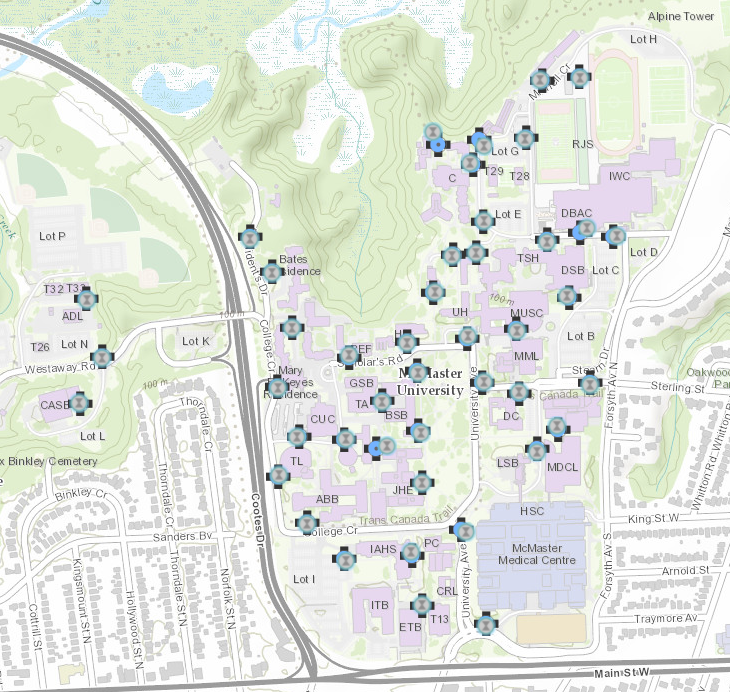
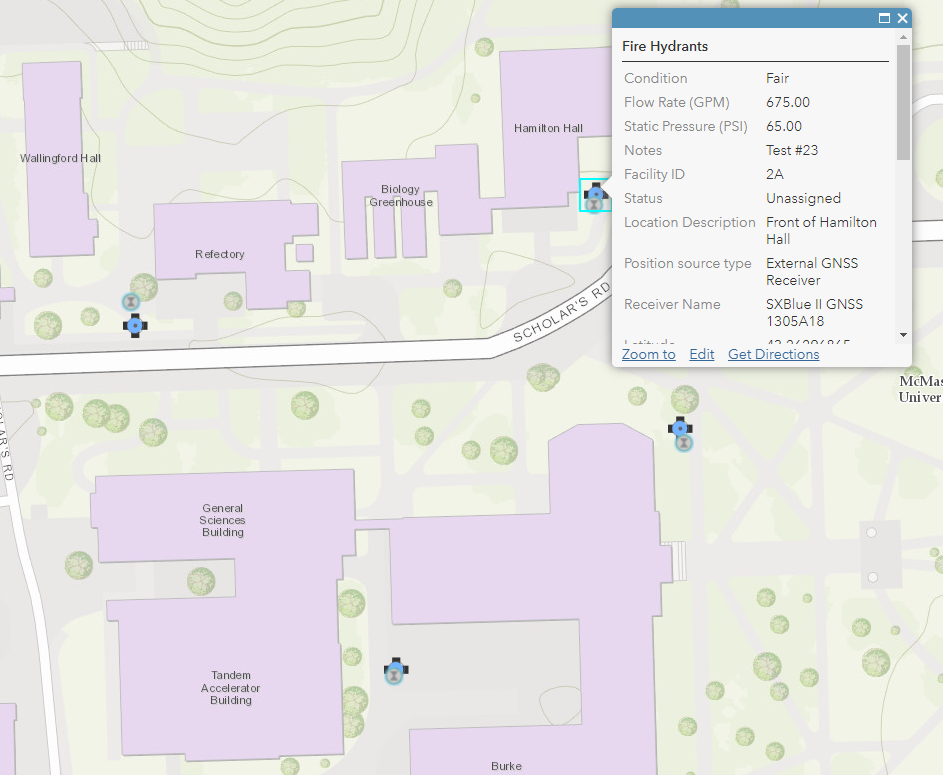
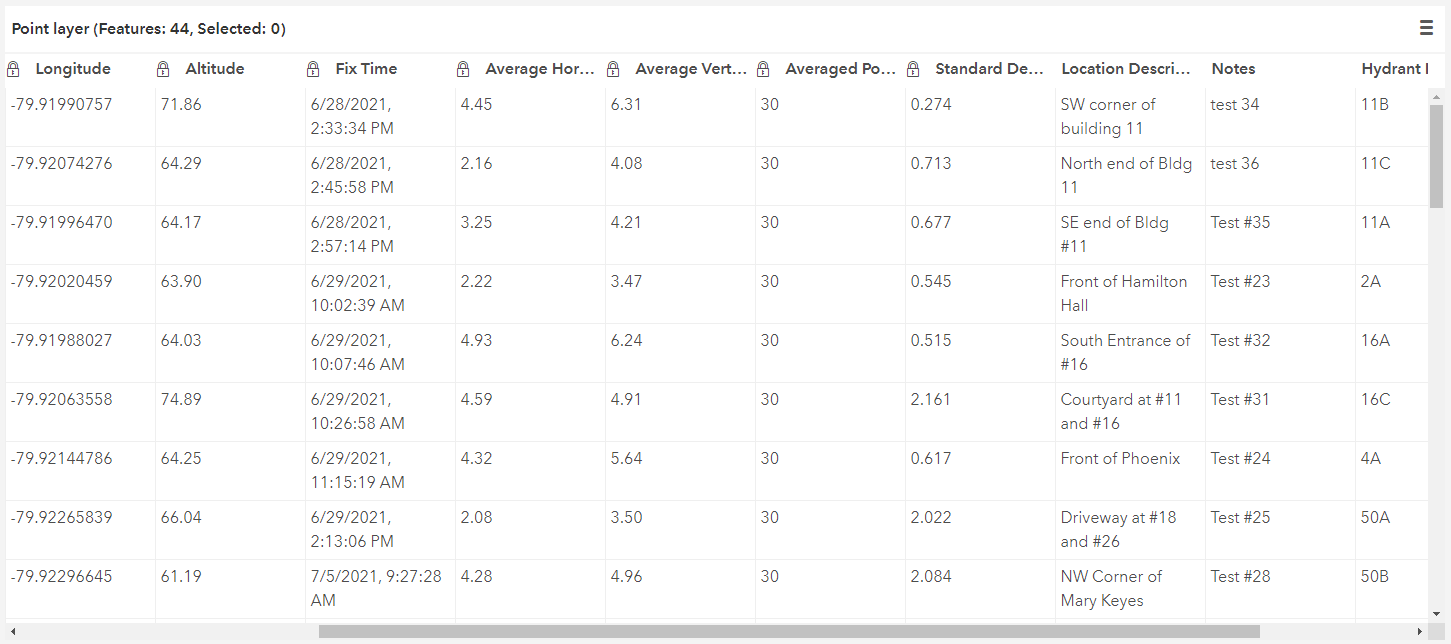
The mobile device being used was a Samsung S7 which was connected to the SXBlue II GPS GNSS through BlueTooth. The GPS device is highly accurate, and aids with obtaining the geographical locations of features within the McMaster Campus. It works directly with the ArcGIS Fields Maps app, which helps display and record these features over the McMaster Campus. This process was also carried out with the corresponding valves of each hydrant. Information collected for these included longitude and latitude coordinates within campus, Hydrant ID (ex: 11B) and Location Description (ex: SW corner of Bldg #11).
Valuable Skills and Experience
The valuable skill I gained from this summer co-op term was finding comfort in using the ArcGIS platform. I believe this skill will lead me to do greater things because once you find your rhythm and know your way around the platform, you are able to be at ease while working on any type of project. I am very thankful for gaining experience in working on real-world tasks, which aids in building up the technical and problem-solving skills that I wouldn’t normally get from lab exercises. As there is no right or wrong answer, you just work to find the best solution to fit your project.
Another key skill I gained was field data collection. Since this task got me outside doing fieldwork during the nice summer days. I have become very familiar with the McMaster Campus inside and out. Since I’ve gone underground to learn about your tunnel network systems.
Next Steps
The Facility Services team and other summer students made this co-op experience absolutely amazing. They were all very kind and welcoming. They all work so hard and go out of their way to teach us so many things about our campus and I believe they are the backbone of what keeps McMaster University up and running.
I was very fortunate to be offered a part-time position by them to keep working during my school term. At the moment, I am working with the ESRI Canada Utilities team to further add to this project, focusing on the service layers that are now maintained as shapefiles with ArcGIS Pro, and to continue collecting data for features around campus, such as manholes. GIS has helped me gain many opportunities and experiences, by which I am happy to say it’s a field I am thankful to be in.