
Quantifying Nationwide Greenspace Accessibility with CANUE
Introduction
Over the past year, I worked with student collaborator Emily Moffat and supervisor Joey Syer from the Canadian Urban Environmental Health Research Consortium (CANUE) to produce a national greenspace provision layer as part of the University of Toronto’s geography professional experience placement course.
Greenspaces refer to varied land designations such as parks, nature reserves, gardens, and sports complexes (Chen et al., 2020). While definitions of parkland vary across literature, urban parks specifically refer to publicly accessible and vegetated open spaces (Konijnendijk et al., 2023). Access to urban greenspaces is vital for individuals to reduce stress and improve overall health by facilitating physical activity and socialization. However, there is a disparity in the provision and accessibility to greenspaces along racial and socioeconomic divisions (Dai, 2011). Greenspace provision refers to the municipal decisions involved in distributing the public amenities of open greenspaces to the socio-spatial landscape of a city (Tan and Samsudin, 2017). Emily and I interpreted this simply as the abundance of greenspace common to individuals in their immediate neighbourhood. Our aim with CANUE was to quantify physical accessibility to greenspace and calculate overall greenspace provision based on the availability of walkable paths.
HealthyDesign.city, CANUE’s public-facing project, is committed to making information about the health effects of Canadian communities’ built environment accessible to urban planners, public health professionals, policymakers, community organizers and engaged citizens (HealthyDesign.city, 2024.). This platform provides tools to visualize built urban environment datasets within the context of census data.
One of these tools is HealthyPlan.city, which combines built environment datasets with vulnerable population metrics to visualize the distribution of indicators of environmental equity in over 120 Canadian cities. The layer we developed with CANUE is called the ‘greenspace provision’ built environment layer.
Overview of Methods
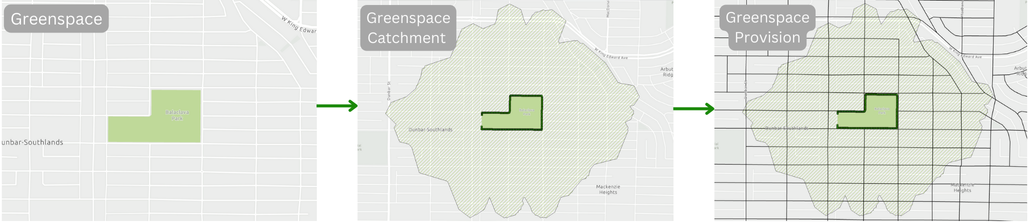
Our goal with CANUE was to produce a nationwide layer, overviewing Canada’s 120 major cities, at the dissemination block (DB) level containing an attribute for greenspace provision for all DBs in the study footprint. Greenspace provision is defined as the area (m2) of greenspace per person. For each unit of greenspace, its area (m2) was divided by the total population within 500 metres walking distance of its boundary. This population was derived by producing a greenspace catchment, depicted in Figure 1. The catchment analysis identifies accessible greenspace boundary entry points, then determines the extent walkable within a five hundred metres walking distance along pedestrian and road networks. Accessible greenspace entry points are those along its administrative boundary within 20 metres of the network and on a landscape with less than a five-degree incline over 30 metres. Python was used to execute this analysis one city at a time.
Detailed Methodology
The first step of our project was to collect the greenspace, slope, network, and census population layers from open-source providers. Greenspaces were defined in our analysis as spaces that are publicly and privately accessible by pedestrians to serve the primary functions of physical activity, socialization, and recreation for users. We obtained this data from OpenStreetMap (OSM) which categorizes map features by tags consisting of a key, referring to a category, and a value, referring to the detail within that key-specified feature. The keys we included in our greenspace definition consisted of parks, nature, recreational nature, outdoor recreation, and national parks. This definition is deliberately broad since municipalities, scientific literature, and everyday users define greenspace differently. The slope layer was prepared by using a 30m Digital Elevation Model derived from Natural Resources Canada (NRCAN), with a slope threshold of five degrees used to estimate locations along the edge of a greenspace that are too steep to access. The accessibility network was also obtained from OSM. Non-pedestrian-friendly roads such as highways were excluded.
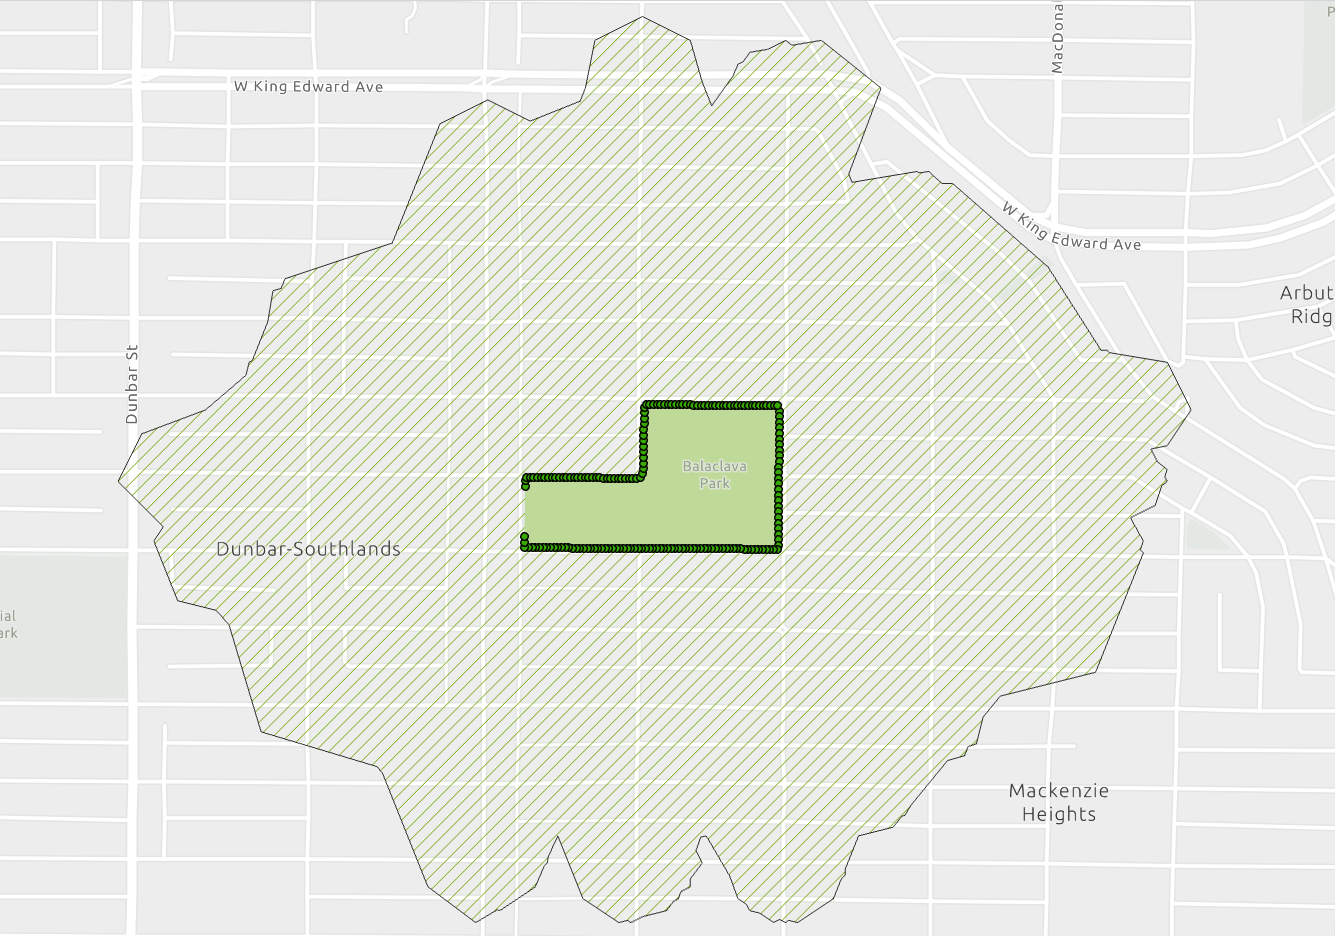
The second step was to develop the catchment boundary of each greenspace, which is defined as the area in which a population can access a greenspace within a 500-metre walking distance. A greenspace’s perimeter is converted into accessible points, defined by those within a slope less than 5 degrees over 30 metres and within a 20-metre distance from the accessibility network. These points served as the input for an ArcGIS Service Area Analysis that calculated the 500-metre catchment for each accessibility point. Finally, all of the accessible point catchments were combined into a single catchment. The resulting catchment boundary can be seen in Figure 2 for Balaclava Park in Vancouver, British Columbia. In this example, the west side of the park is not accessible, indicated by the lack of points, due to factors of steepness and distance to nearby paths, and thus a user would have to walk to another accessibility point on the greenspace boundary to enter the area.
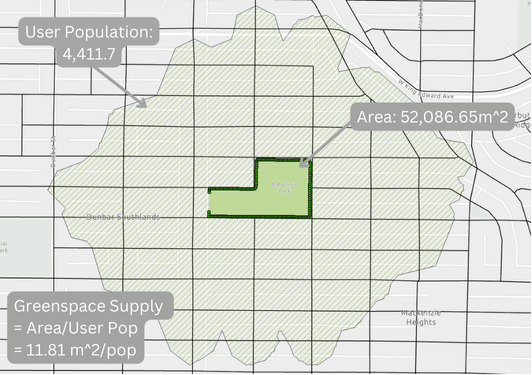
The third step was to calculate the supply value of each greenspace per DB. DBs are depicted in Figure 3, shown with a black outline. Greenspace supply is calculated by dividing the area of each greenspace by the user population, the latter of which is the sum of the census population included within the catchment boundary of said greenspace. For DBs partially within the catchment, the proportion of the DB covered was used to calculate the proportion of the DB population contributing to the user population rather than taking the entire DB population.
Greenness was calculated for each greenspace and then assigned to each overlapping DB. Again, for partially overlapping DBs, the greenness value was only applied to the proportion of the population the catchment overlapped. Last, any given DB can have many overlapping catchments, so the sum of all greenness values was calculated per DB.
Using Figure 3 as an example, Balaclava Park is a greenspace with an area of 52,086.65m2 whose greenness value is 11.81 m2 per person when the catchment fully overlaps a DB of 4,411.7 people.
Results and Discussion
The final greenspace provision layer for Vancouver can be viewed in Figure 4 which was produced in ArcGIS Pro. Greenness provision (m2/person) was used to classify the layer using a manual interval graduated colour scheme to show differences in greenspace provision. This final layer is now available for over 120 major cities across Canada and integrated into the HealthyPlan.city tool.
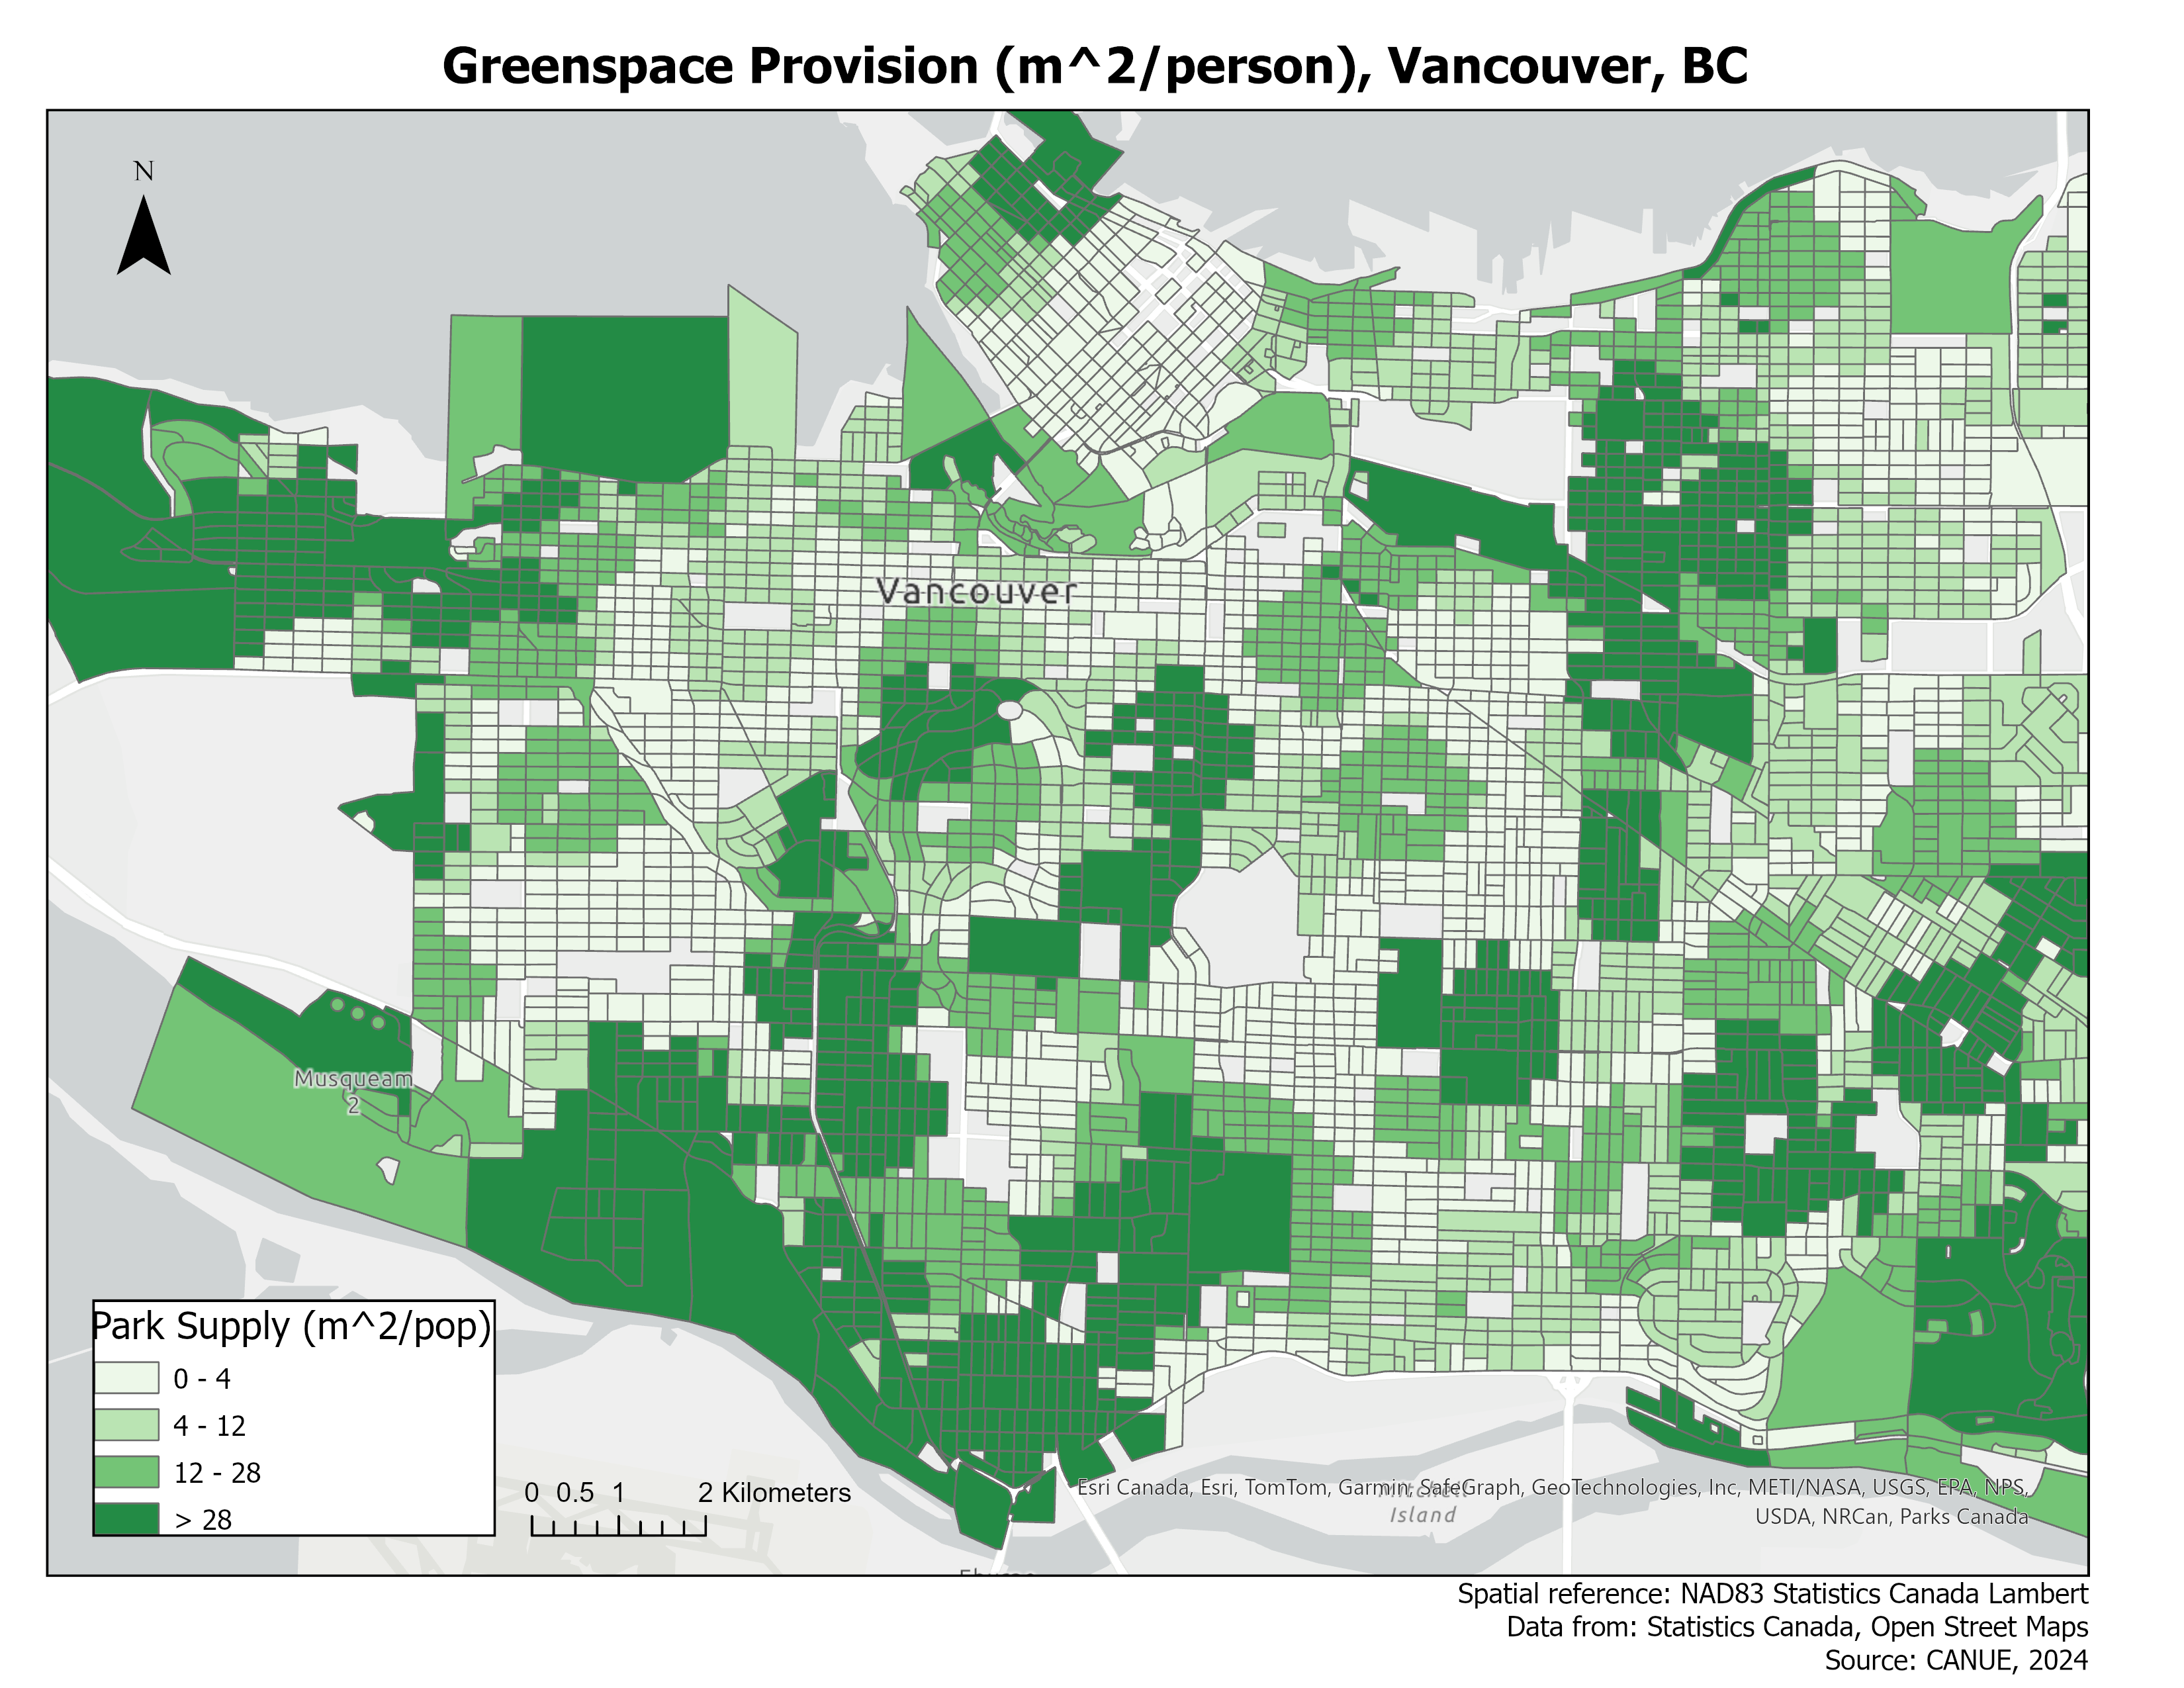
The greenspace provision layer in Vancouver identifies the neighbourhoods of Shaughnessy, Marpole, Coal Harbour, Point Grey, Kitsilano, and Champlain Heights with higher greenness values. This indicates that these neighbourhoods have higher access to greenspaces per person due to either being located closer to more greenspaces and/or living in less densely populated neighbourhoods. Meanwhile, the neighbourhoods of Downtown West, Kerrisdale, Oakridge, and Mount Pleasant have lower greenness provision. Integrating this layer with HealthyPlan.city can contextualize these patterns of greenspace provision with vulnerable populations.
There are limitations in our methodology and data. Our reliance on OSM data can reduce the accuracy of our analysis because user-defined greenspace inputs and network categories can lead to the unintended inclusion and exclusion of greenspaces. The reliability of our methods could not be fully validated given the varying definitions of greenspaces across Canada, especially with cities of varying scales. We were constrained to apply one approach to over 120 cities while maintaining consistency in our representation of greenspace provision regardless of differing population levels across cities, which can inevitably misrepresent how individual cities define access to greenspace.
Conclusion
Through a planning lens, public greenspaces represent a limited common resource supply that is valuable and sought after by stakeholders such as the municipal government and private developers due to its potential for urban development (Chen et al., 2020). However, the public possesses the right to understand the management and patterns of the distribution of greenspaces in their respective cities. This project serves as a starting point to harness the widespread availability of open-source geospatial data like OSM to democratize the ability to assess greenspace access.
Works Cited
CANUE, (2024). The Canadian Urban Environmental Health Research Consortium understanding urban living and human health. https://canue.ca/.
Chen, Y., Yue, W., & La Rosa, D. (2020). Which communities have better accessibility to green space? an investigation into environmental inequality using Big Data. Landscape and Urban Planning, 204, 103919. https://doi.org/10.1016/j.landurbplan.2020.103919.
Dai, D. (2011). Racial/ethnic and socioeconomic disparities in urban Green Space Accessibility: Where to intervene? Landscape and Urban Planning, 102(4), 234–244. https://doi.org/10.1016/j.landurbplan.2011.05.002.
HealthyDesign.city. (2024). Mission. https://healthydesign.city/our-work/.
Konijnendijk, C. C., Annerstedt, M., Nielsen, A. B., & Maruthaveeran, S. (2013). Benefits of urban parks. A systematic review. A Report for IFPRA, Copenhagen & Alnarp, 70.Tan, P. Y., & Samsudin, R. (2017). Effects of spatial scale on assessment of spatial equity of urban park provision. Landscape and Urban Planning, 158, 139-154.