
Distribution of Truck Rest Events in the Region of Peel
For long-haul truck drivers finding space to rest is a major issue. They face many hours-of-service regulations that present issues for accessing rest at different periods throughout the day. Areas of considerable freight activity need to focus on addressing these needs.
The Region of Peel contains the municipalities of Mississauga, Brampton, and Caledon and is situated to the west of Toronto (Canada’s largest city). It represents a major area of freight transport in the Greater Toronto Area, mainly due to the fact of Pearson International Airport (Canada’s largest) being situated in Mississauga. As such, a significant portion of freight activity (and manufacturing and other major industry) occurs adjacent to the airport in northeast Mississauga.
The original research I have been working on is focused on the plotting of GPS data of parking events of truck drivers to understand the trends within the Region. My focus was on a sample of events occurring in the Summer of 2014. I used ArcGIS Pro to plot these points on top of a shapefile that contains the Region’s Transportation Analysis Zones (TAZs), which are units of area that have similar characteristics that contribute to transport activity. These zones are defined through the Transportation Tomorrow survey which collect data of urban transport in southern Ontario. More information on this survey can be found here: http://www.transportationtomorrow.on.ca/
To help examine the trends in activity, two forms of spatial processes were performed on the data: Spatial Join and Kernel Density. Spatial Join was used to combine the GPS point features with the corresponding TAZ in the region. This provides insight into which zones or broader areas have significant rest activity, allowing the trends in rest activity to be considered relative to the unique characteristics of each area. The Kernel Density function produces a heat map type of visualization that uses different gradients of colour to represent increasing units of events per unit area. The units used for this analysis was the number of events per square km2. While both analysis tools enable visualization of spatial distribution of rest activity, the Spatial Join effectively provides a raw count of events within a predefined boundaries. In contrast, the Kernel Density tool’s output reveals density of rest activity per unit of area for a specified distance threshold, and does not take boundaries like TAZs into account.
In the figures below, the plot of both types of analysis is presented. For confidentiality’s sake, the legend is to be removed with the numerical distinction between visualization patterns not defined.
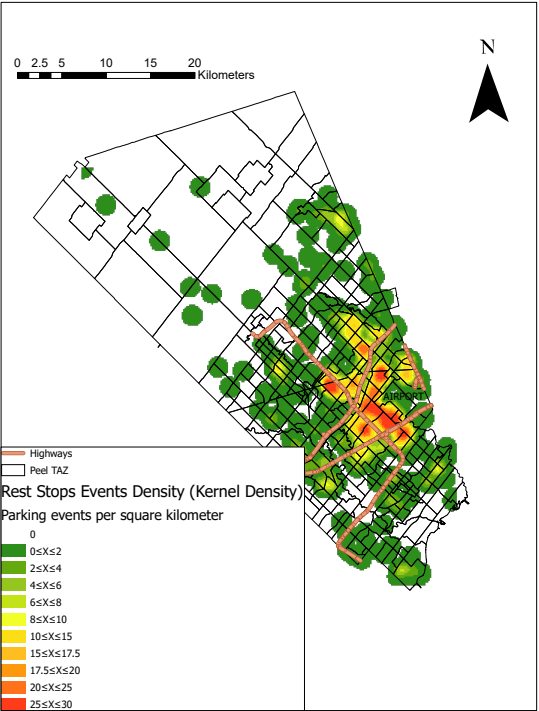
Within the Kernel Density plot, the color of green represents areas in which there is relatively low density of truck rest events occurring in the Region. The green transitions to yellow for medium density and red at its highest level of density. For context, Pearson Airport is to the east of the peak red content in the northeastern border of Mississauga. As expected, the peak activity is occurring adjacent to the airport. There are also other areas of interest that include the Hwy 410 corridor and intersecting freeways in Brampton and the Bolton area that is seen in the north eastern portion of this figure in Caledon.
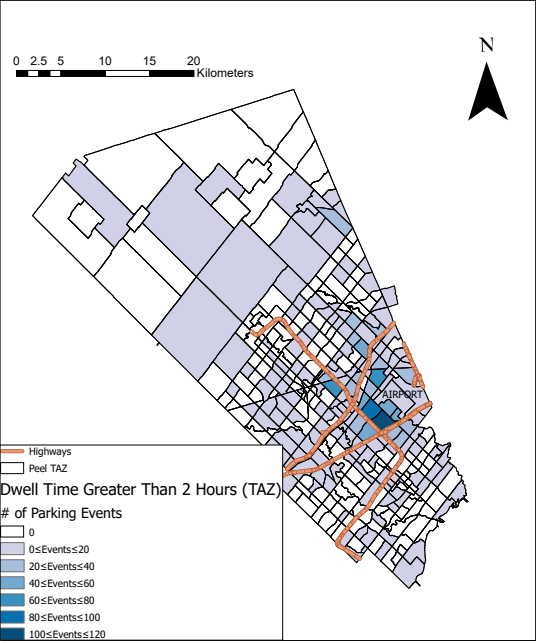
In the map displaying the Spatial Join results shows areas with low frequency of truck rest events in light purple colour, transitioning to dark blue to indicate areas with higher frequencies of rest events. Again, it is evident there is a significant presence of truck drivers resting near the airport. However, the distinction to be made between the analyses is that low-level activity seems to be more uniform in appearance in the rest of the Region compared to the Kernel Density analysis where pockets of medium activity are evident throughout.
Currently, the research I am working on is focusing on the pandemic and the issues of safety for truck drivers who are at increased risk of exposure to COVID 19. Furthermore, since 2014 there has been a significant increase in participation of e-commerce from the public and industry which may also shift trends in freight. These trends will be the focus of posts going forward.