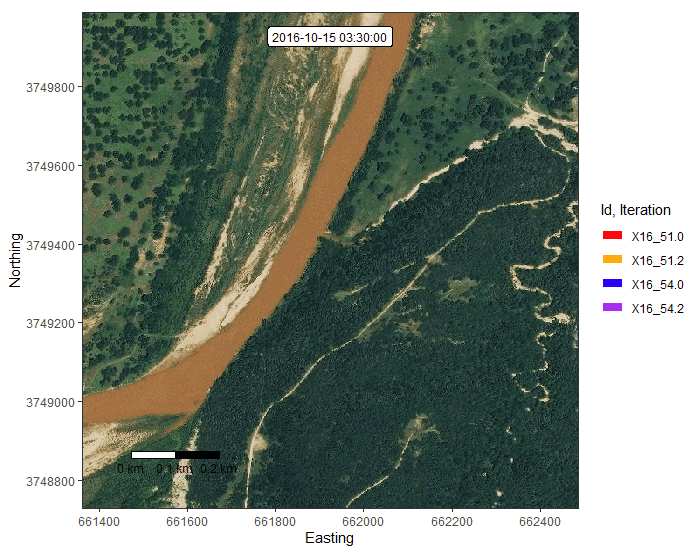
 Uncovering the Power of Remote Sensing in Micrometeorological Studies
Posted 2 years ago
By Karlos Lao in the Western Blog
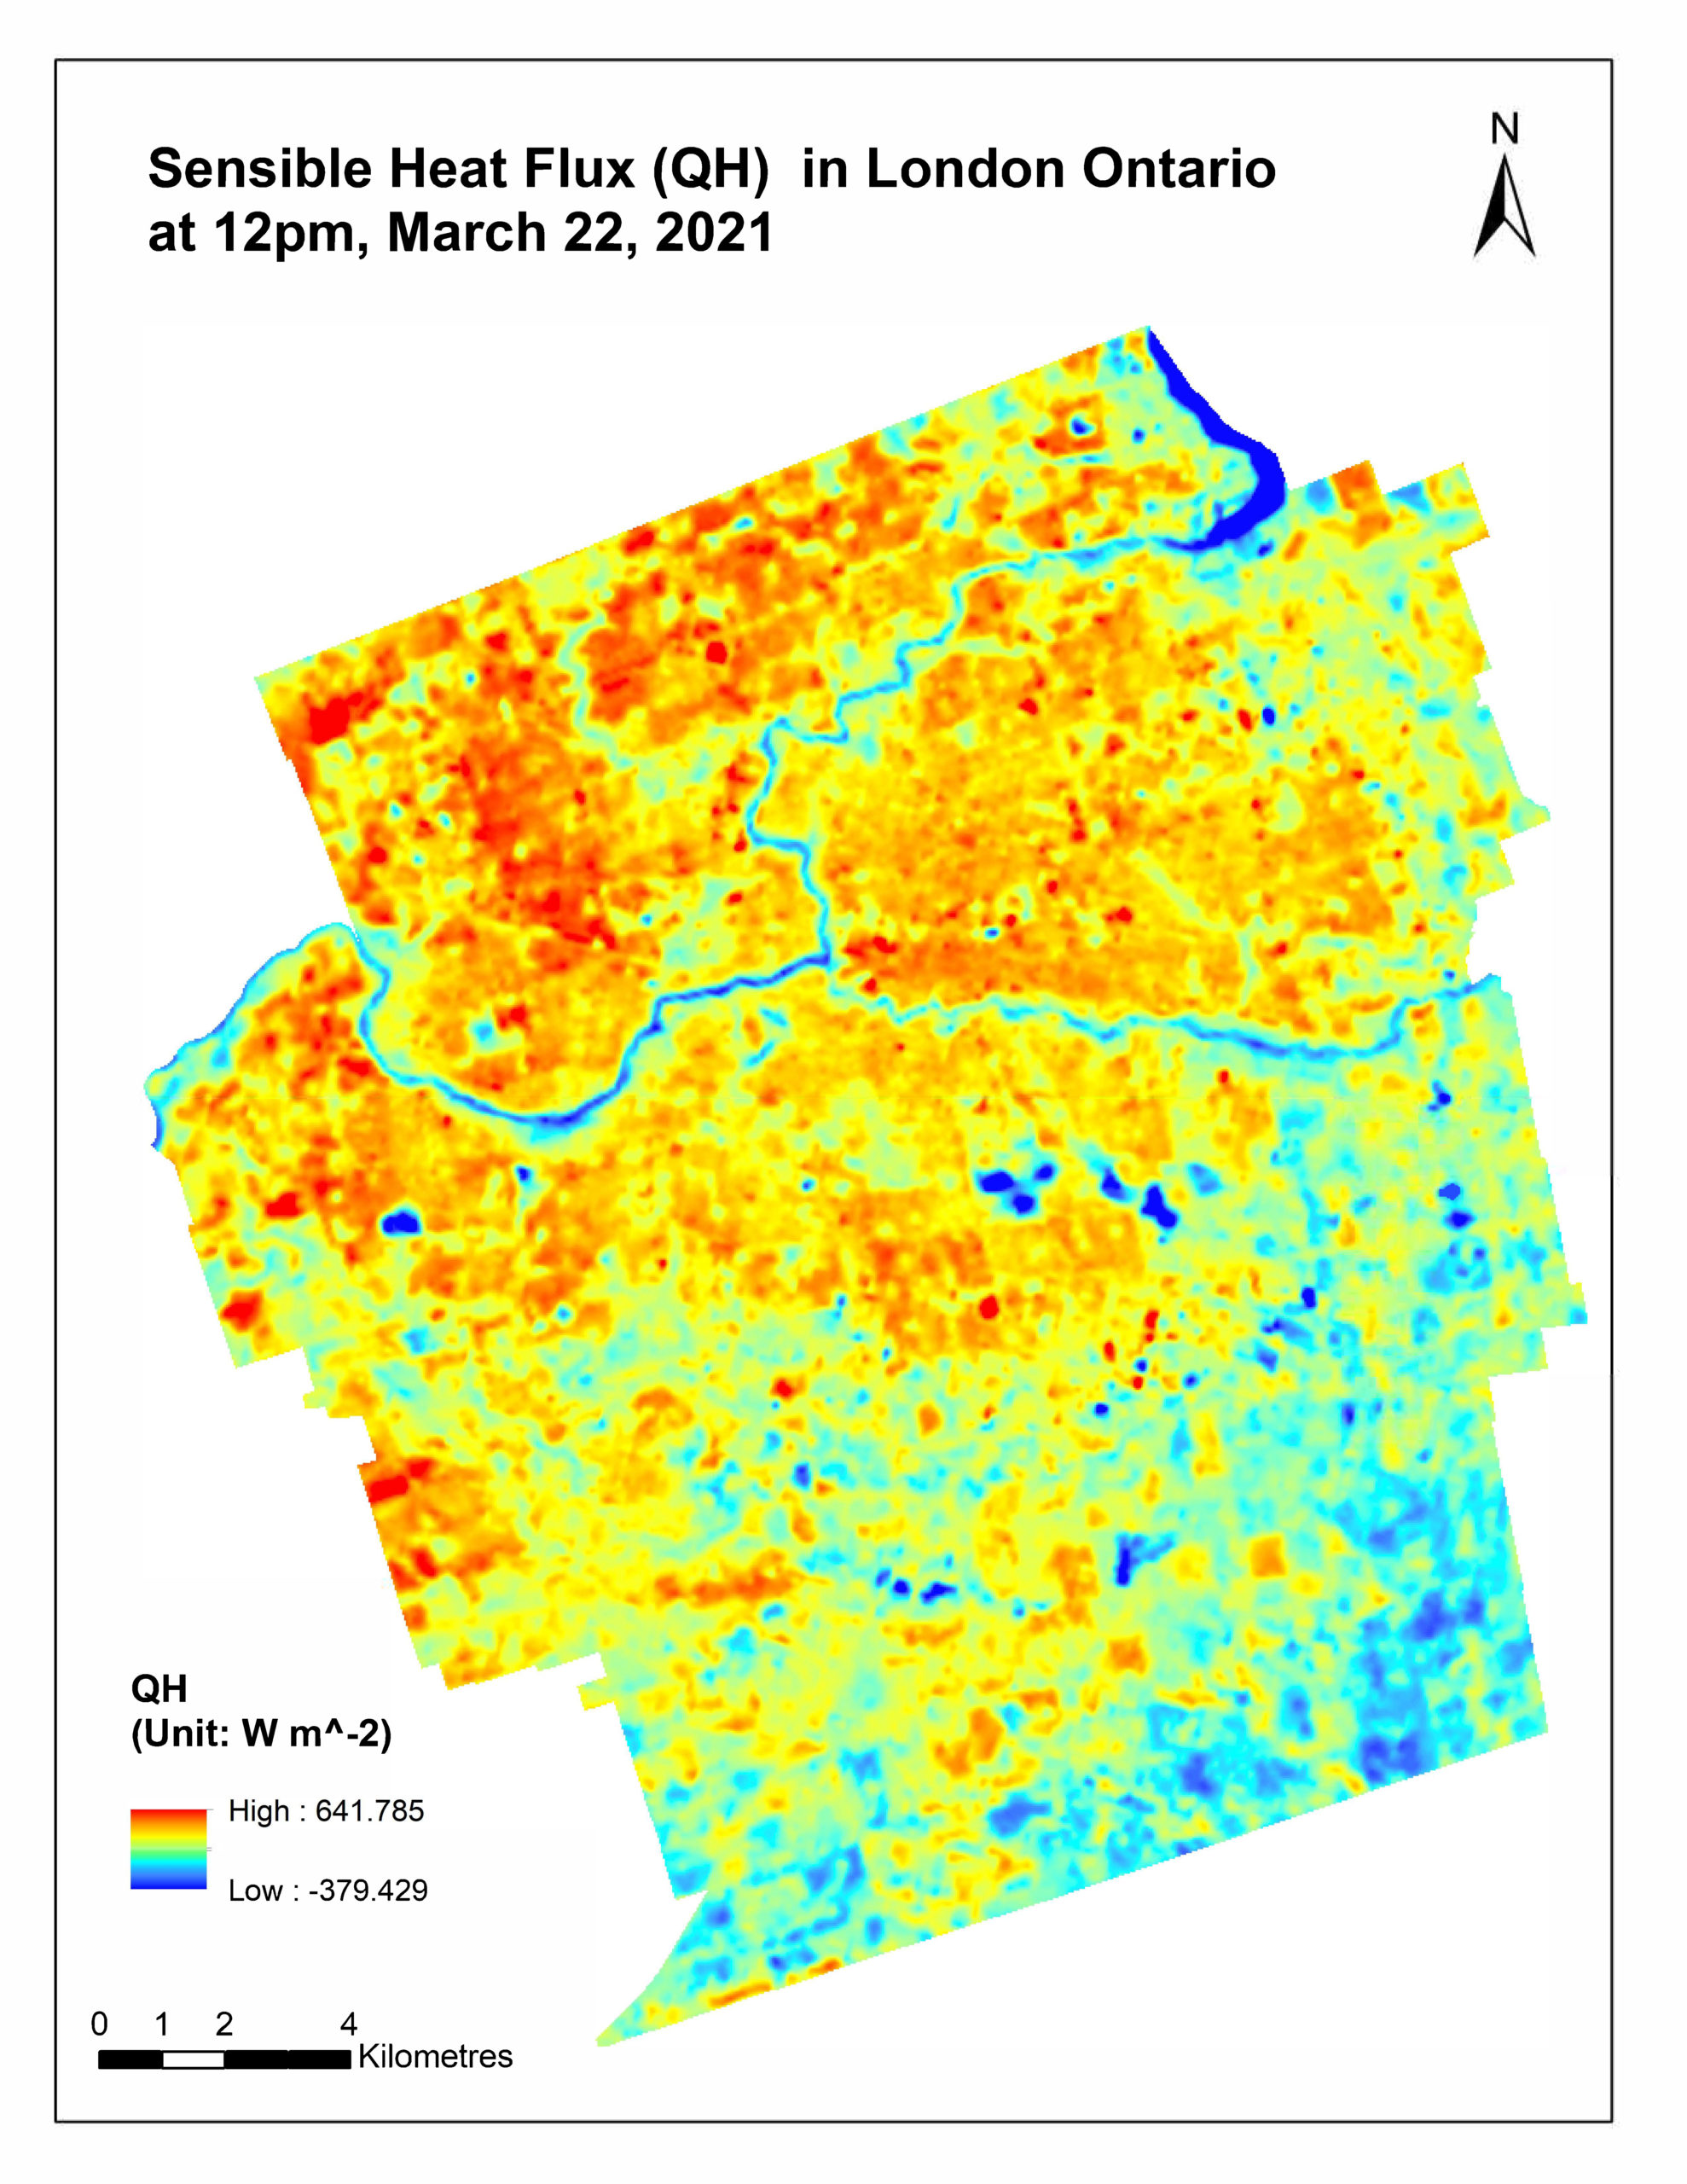
In my third-year micrometeorology class with Dr.Voogt, we were assigned a course project to work in small groups throughout the term, and each group had to conduct a research project for related to microclimate or micrometeorology. The course covered a wide range of topics such as solar radiation budget, soil microclimates, surface temperatures, etc. For […]
Read More
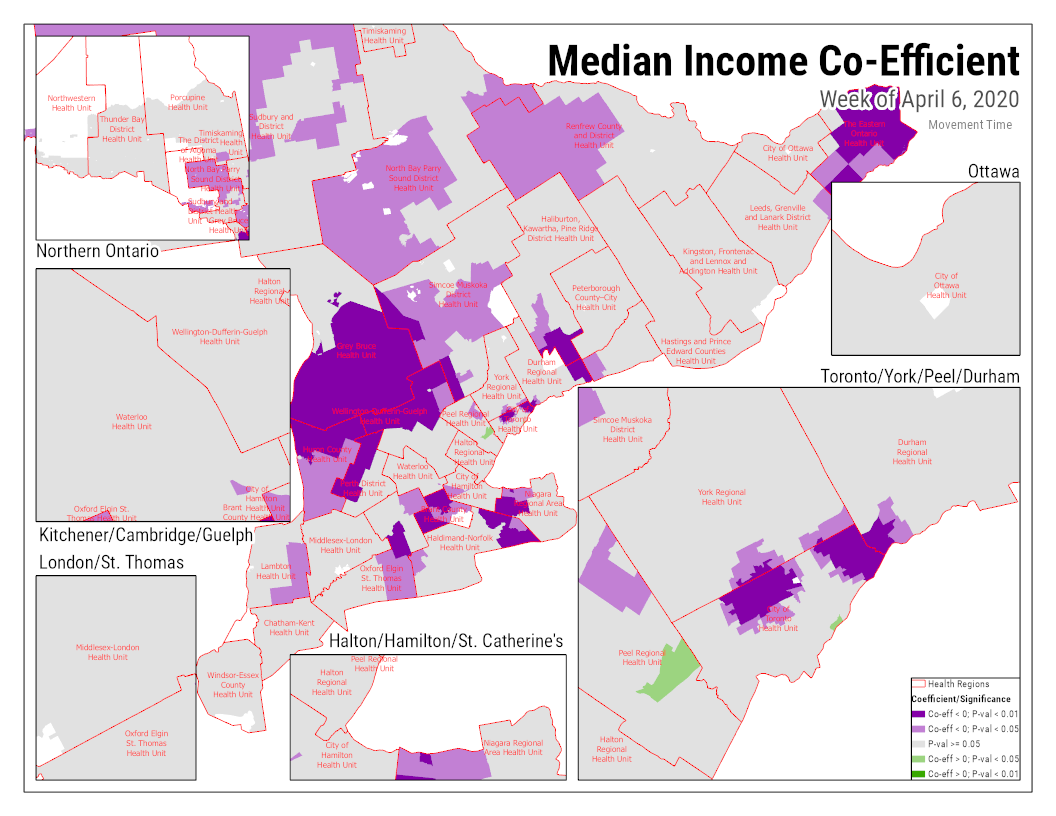 Using an ArcGIS Pro Python Noteboook to display results of a GWR model
Posted 2 years ago
By Ben Klar in the Western Blog
The Built-in Python notebooks feature in ArcGIS Pro is very useful for creating an automated and reproducible workflow for complex analysis. Personally though, my best use of the ArcPy library in ArcGIS Pro has been for a fairly simple purpose – to create multiple maps iterating over a categorical variable’s values. I often find myself […]
Read More
 Using ArcGIS Pro and Python Notebooks to Look at The Interaction of Deer and Hunters in Oklahoma, USA
Posted 2 years ago
By Caitlyn North in the Western Blog
Over the past summer I had the pleasure of working with Dr. Long here at Western University as a part of the Undergraduate Summer Research Internships program. I learned a tremendous amount about GIS software, particularly ArcGIS pro. I used this time to explore tools and features that I had not previously been taught in […]
Read More
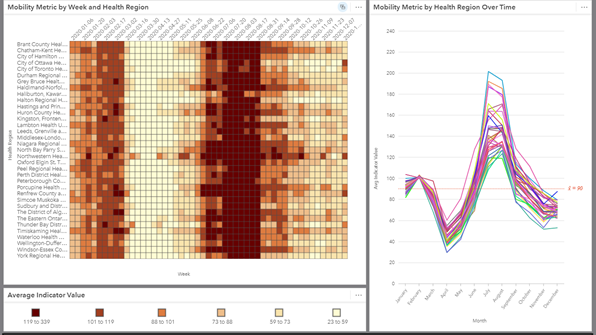 Mobility Patterns During COVID-19 with ArcGIS Insights
Posted 3 years ago
By Ben Klar in the Western Blog
I’m sure we’re all well aware of the many impacts that COVID-19 has had on our typical lives. Working from home, attending school from home, and limits on social gatherings have significantly reduced our mobility. The Geospatial Lab at Western University has been working on a project to look at how mobility has changed over […]
Read More
 Presenting at GIS Day 2020
Posted 3 years ago
By Jack McIlraith in the Western Blog
Like all other events, whether professional, academic or even social, GIS day events at Western went online this year. The organizers of GIS day at Western, Western Libraries, put together four days of free online lightning talks, workshops, demonstrations and networking sessions. Due to the online format, students and professionals from across and even outside […]
Read More
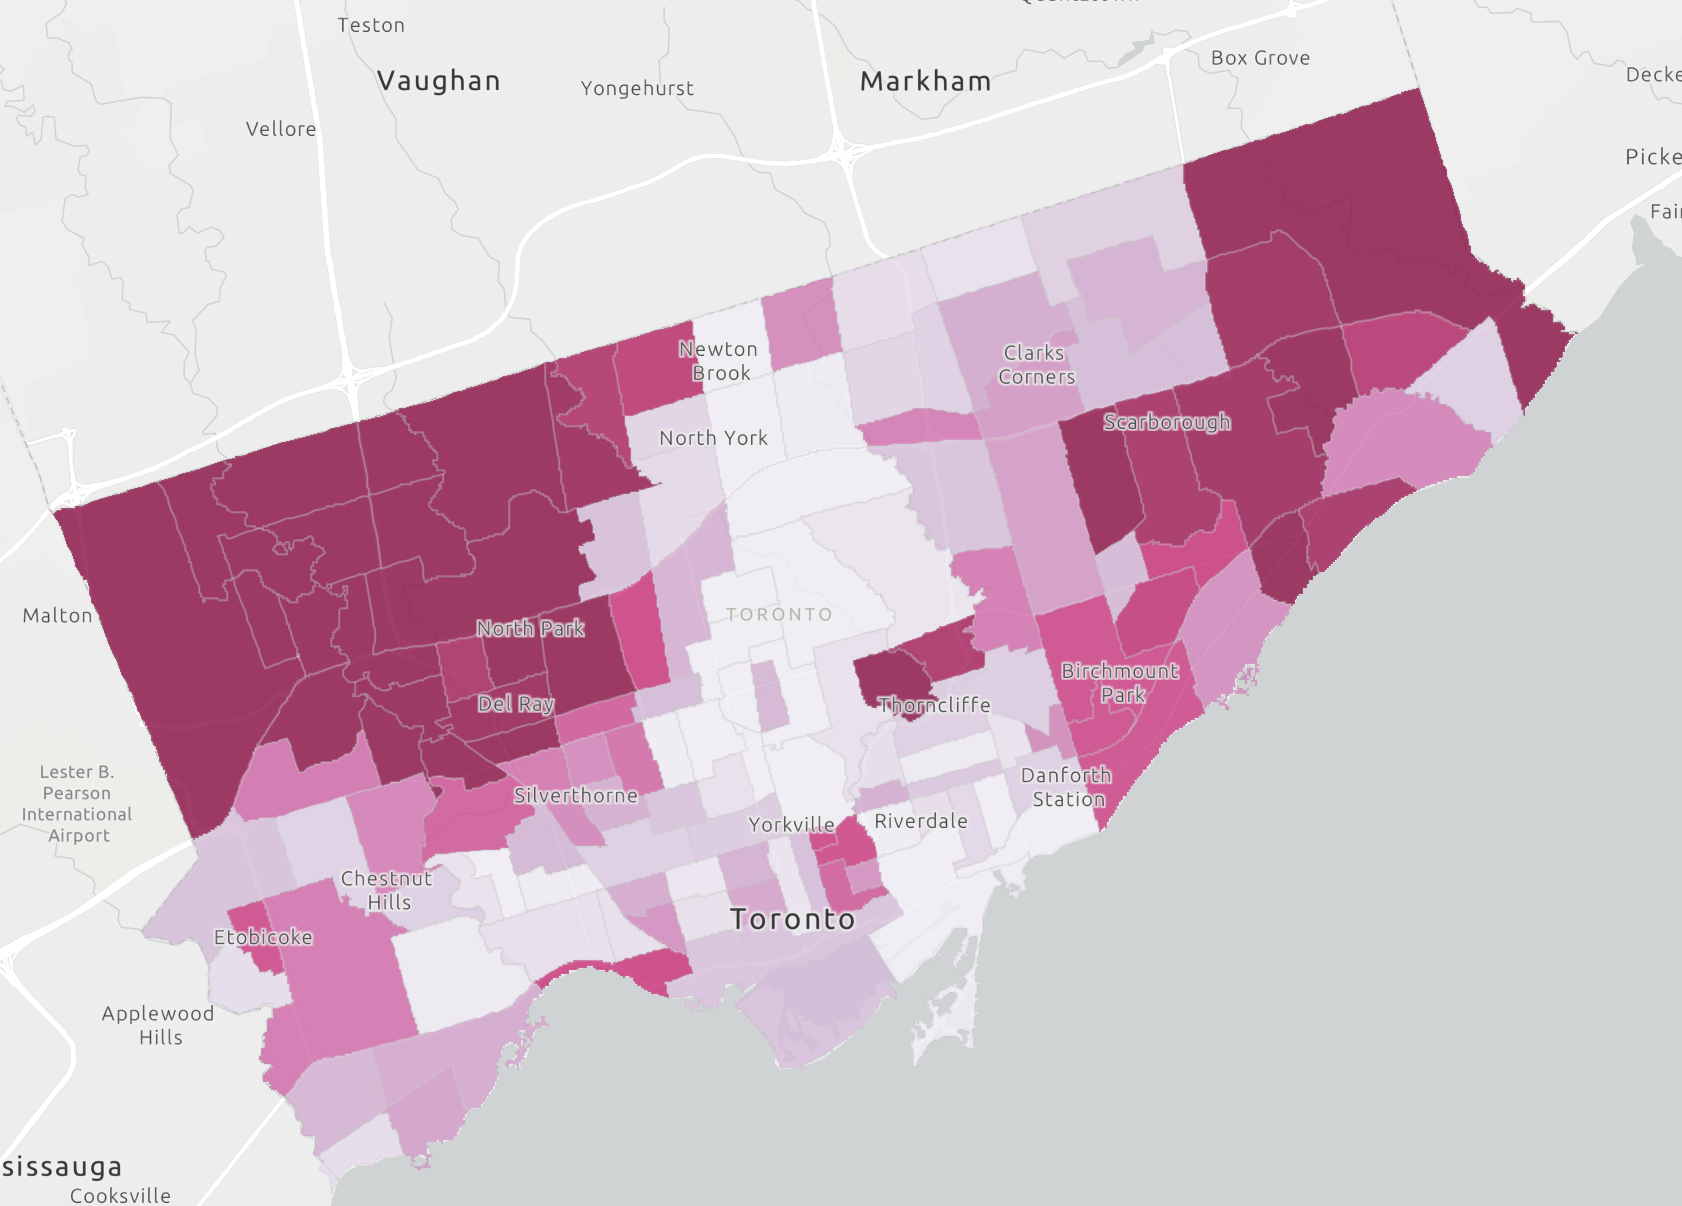 Using Geoenrichment to analyze socioeconomic factors affecting the spread of COVID-19 in Toronto, Ontario.
Posted 3 years ago
By Caitlyn North in the Western Blog
Using Geoenrichment to analyze the spread of COVID-19 in Toronto, Ontario
Read More
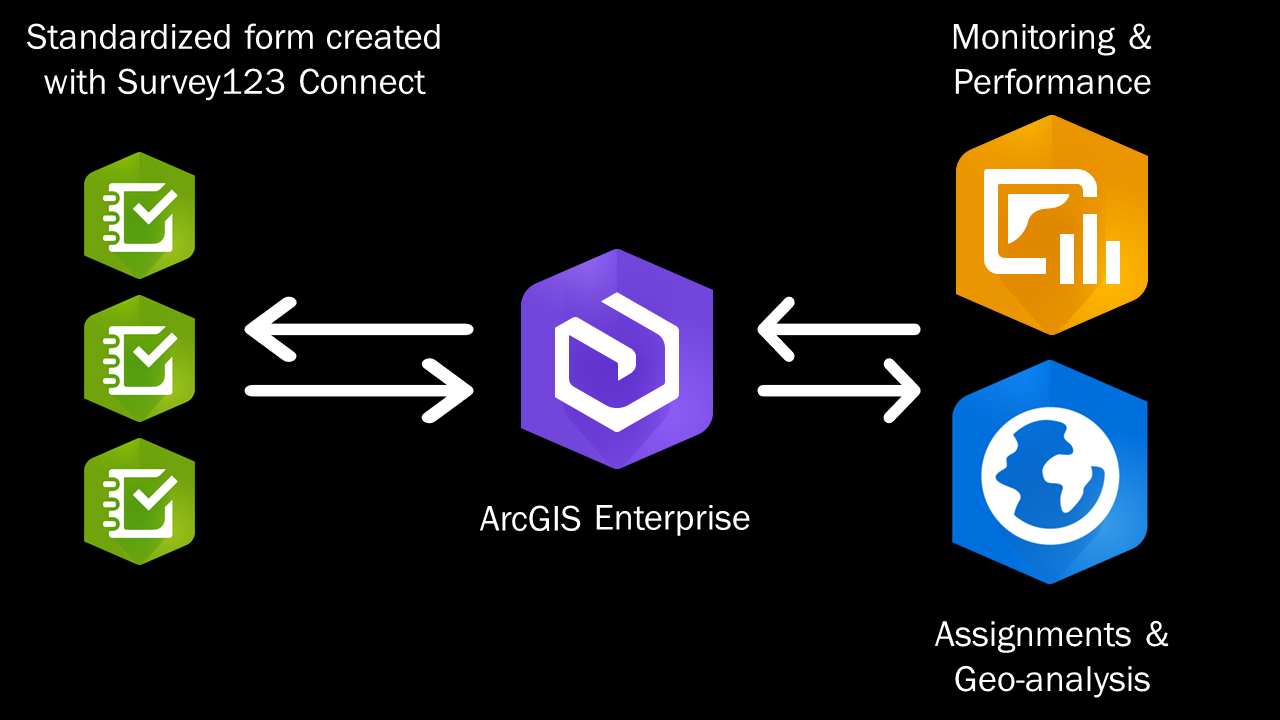 Using Survey123 and Portal for ArcGIS to manage a large team related to COVID-19 economic recovery research
Posted 3 years ago
By Alexander Wray in the Western Blog
Learn how the Human Environments Analysis Lab (HEAL) at Western University has implemented a large research project on COVID-19 economic recovery using Survey123 and ArcGIS Enterprise.
Read More
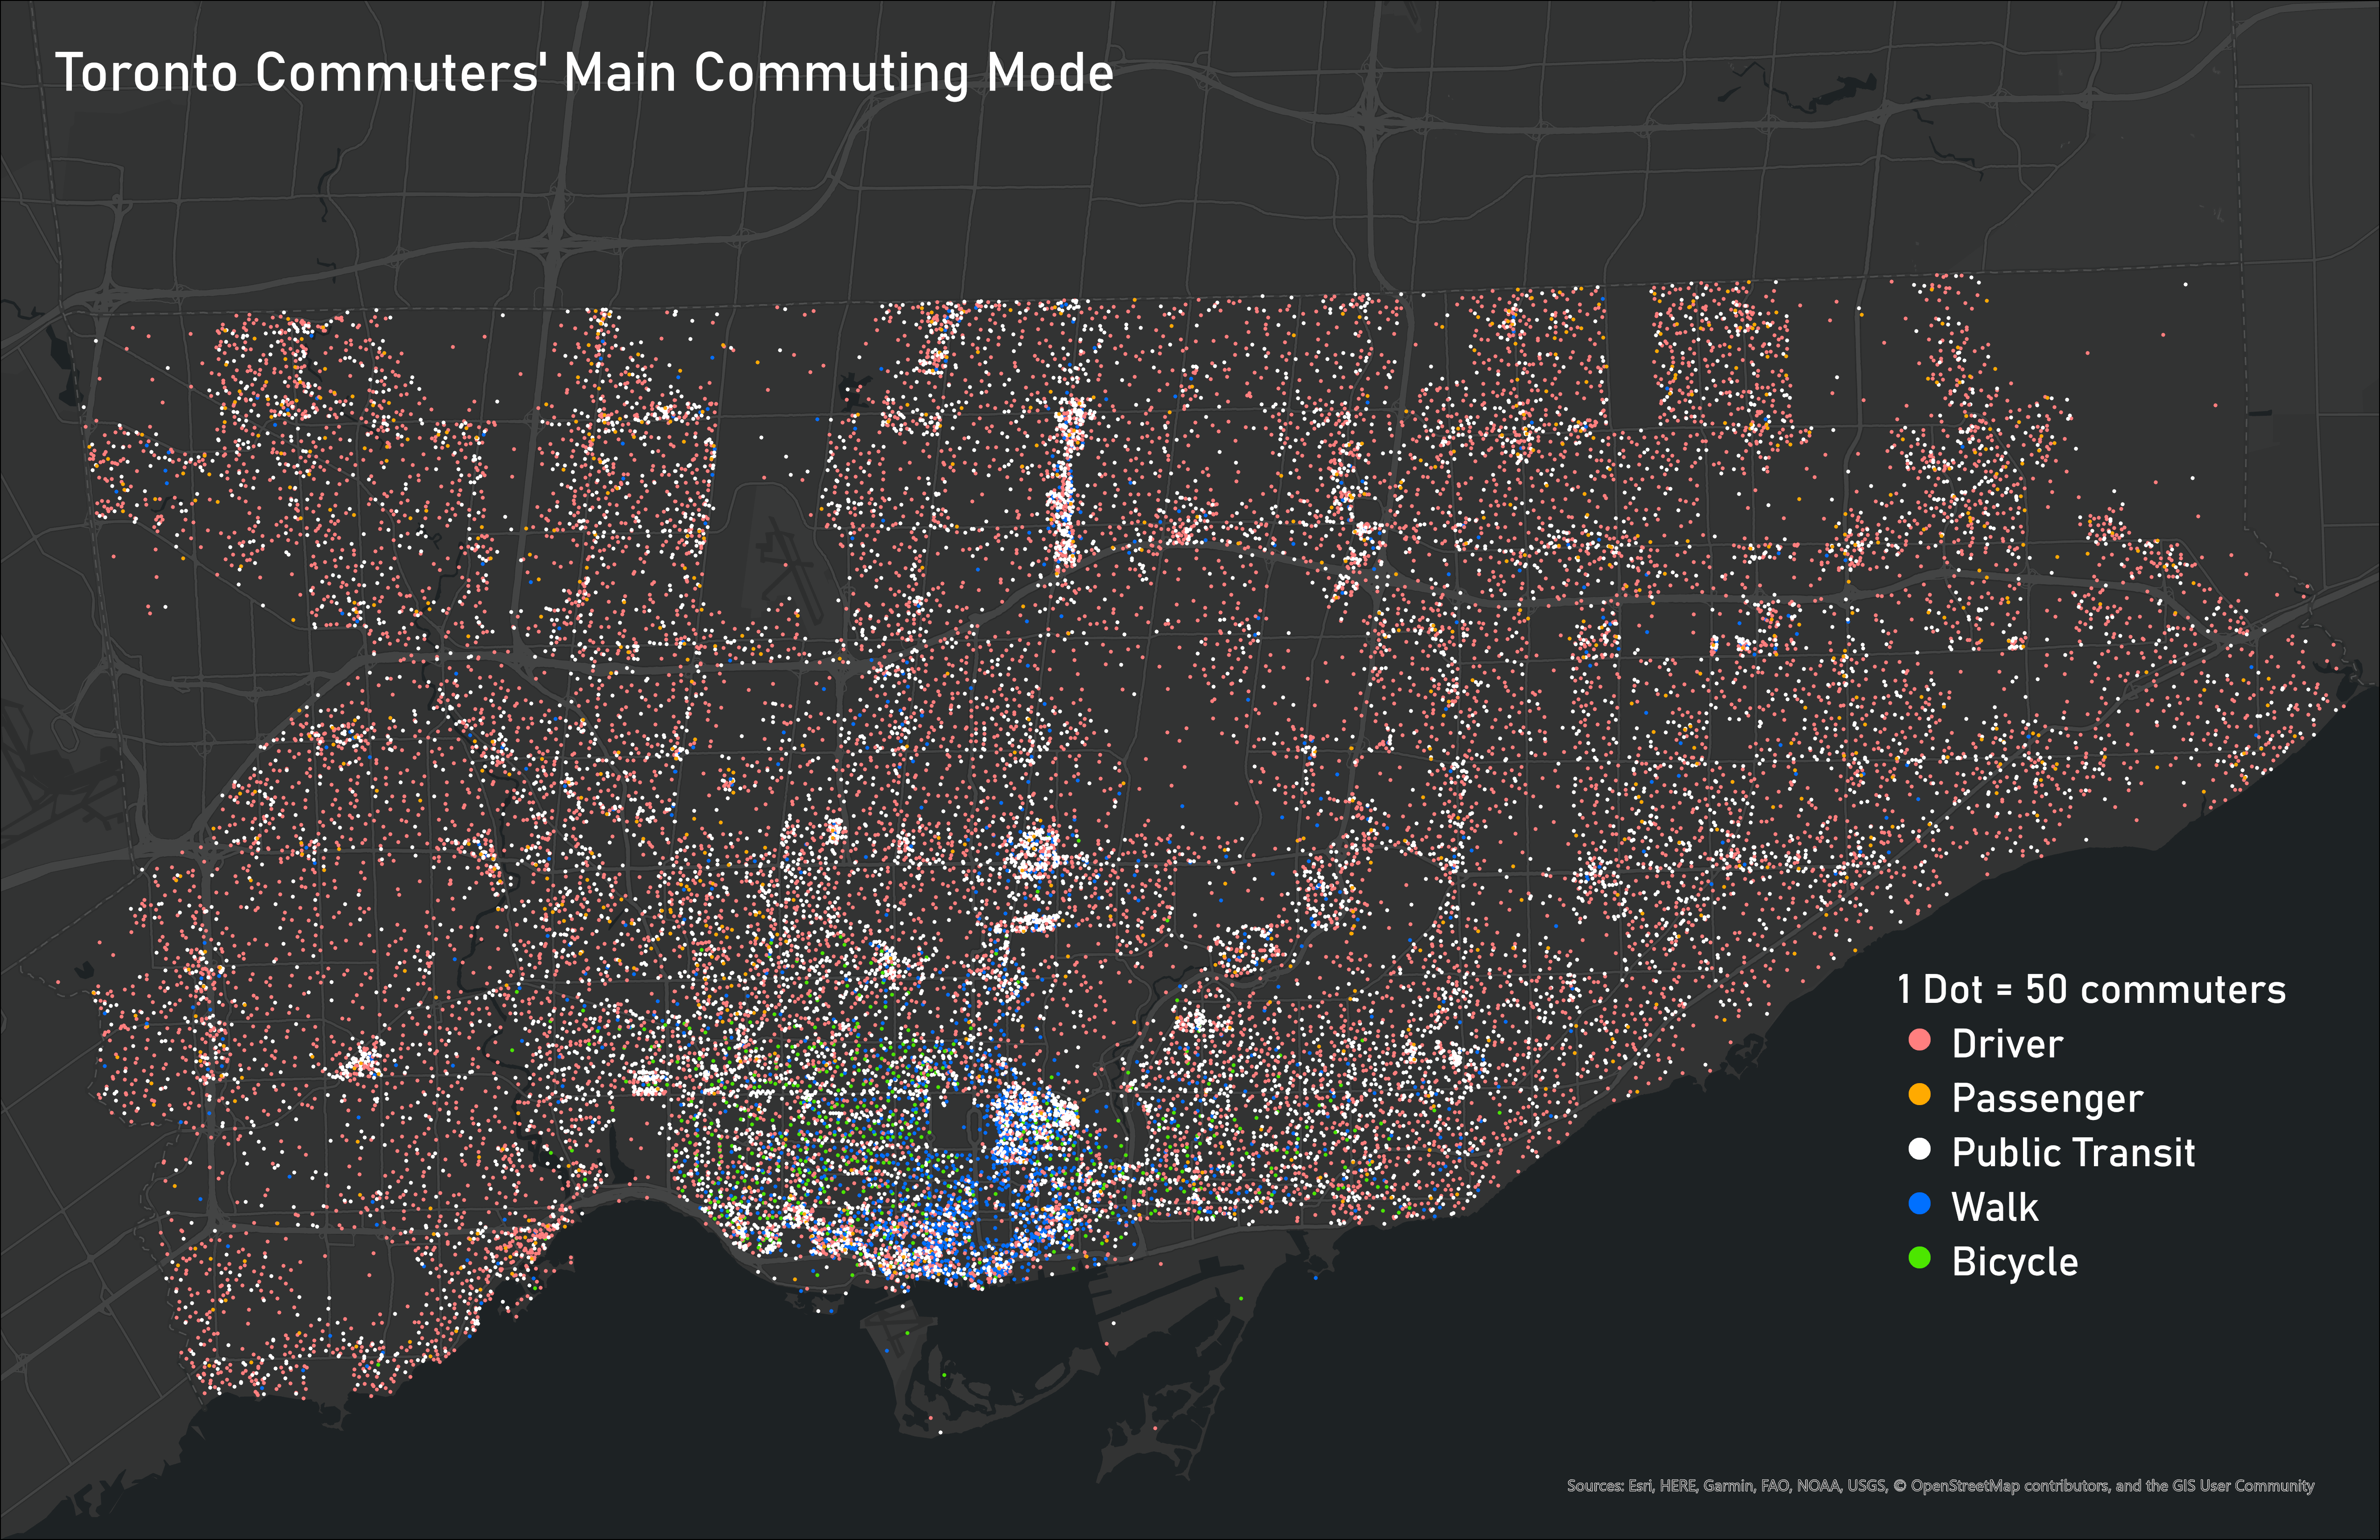 Ideas for Displaying Categorical and Time-Based Data
Posted 4 years ago
By Ben Klar in the Western Blog
Deciding the best way to visualize your data is one of the most important steps in making sure that message is clear and understood by the reader. But when you are working with many different variables, it can be challenging to display them all together on one map to show the connections between different categorical […]
Read More
 The Completion of the ECCE App Challenge 2020
Posted 4 years ago
By Victoria Barlow in the Western Blog
This was my second year completing the ECCE App Challenge. This year was exciting as I was able to build off of what I had learned about the challenge last year and it was my first time being a team leader. The challenge went differently than expected as it had to be completed through virtual […]
Read More
 Presenting at the Esri GIS in Education and Research Conference
Posted 4 years ago
By Jack McIlraith in the Western Blog
So far, my masters program has consisted of me learning to do a lot of things I haven’t done before. One of the latest firsts was the chance to present some of my masters research at the Esri Canada GIS in Education and Research Conference at the University of Toronto. While I was preparing, I […]
Read More