
Developing A Level of Traffic Stress (LTS) Network using R and ArcMap
While cycling is a physical activity with recognized benefits, injury events do occur. Between 2006 and 2017, 890 cyclists died in Canada, averaging 74 deaths per year. Collisions with motor vehicles made up 73% of these fatal cycling events. In addition to deaths, about 7,500 cyclists were seriously injured every year during the same period (Statistics Canada, 2019). As a result, multiple transportation agencies have shifted their primary area of focus to investing in safe cycling infrastructure (Chen et al., 2017). Mekuria et al. (2012) proposed level of traffic stress (LTS) as one such method to improve cycling safety. The level of Traffic Stress (LTS) model was originally proposed by the Mineta Transportation Institute (MTI) as a new scheme for classifying road segments by one of four levels of traffic stress:
- LTS 1 is meant to be a level that most children can tolerate
- LTS 2 is tolerated by the mainstream adult population
- LTS 3 is tolerated by American cyclists who are “enthused and confident” but prefer having their own dedicated space for riding
- LTS 4 is a level tolerated only by those characterized as “strong and fearless”
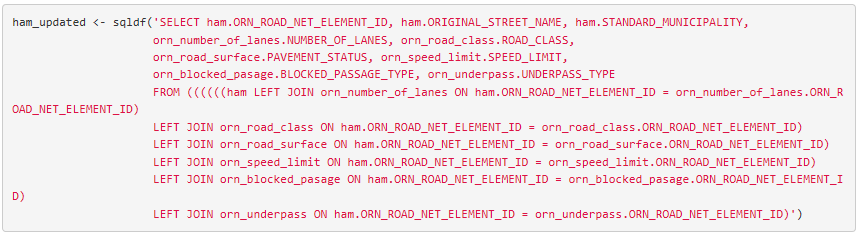
The criteria used for classifying road segments by level of traffic stress include segment characteristics (traffic speed, number of lanes, type of road) and whether cyclists are in mixed traffic, on bike lanes or use segregated paths. An LTS Network for the City of Hamilton to assess cyclist safety and infrastructure was developed using R and ArcMap using Open Data and previously processed datasets based on map-matched algorithms in the Transportation Research Lab at McMaster University. Full documentation on network development can be found on Github. Below is a quick run down of the process I employed to develop an LTS Network for the City of Hamilton. ORN_ROAD_NET_ELEMENT, a shapefile with subsequent .csv files, was queried using sqldf, a function in R used to find all records corresponding to the City of Hamilton, including original street name, number of lanes, road class, pavement status, speed limit, underpass type and category
The data frame was then joined back to the original shapefile using a foreign and primary key through a left join function based on network ID and then exported in ArcMap using a Spatial Join. At this point, there is a shapefile with close to 20,000 records, each representing a single road segment, with the appropriate information to code for an LTS rating.
The shapefile, now brought back into R and turned into a data frame once again, is processed according to criteria outlined by MTI to develop LTS ratings for every road segment in the network.
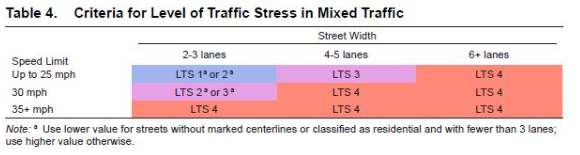
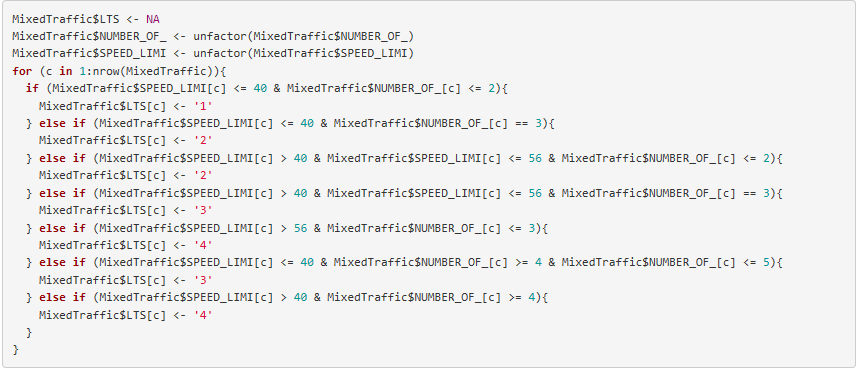
Mixed traffic is a type of road category. Mixed Traffic is where cyclists share space on the road with motor traffic – it is proposed that the level of stress when riding in mixed traffic depends on the prevailing traffic speed and number of lanes. The following block of code was implemented for developing LTS for this portion of the network:
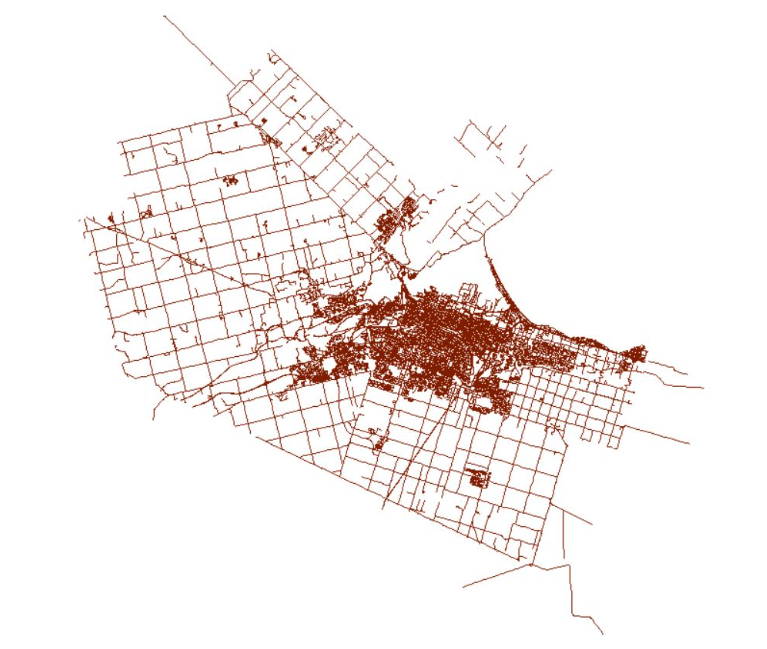
Similar code is executed for developing the rest of the LTS network using different criteria outlined in the MTI report based on the type of road classification such as road segments with bike lanes or major roads. Data wrangling and processing is completed in R for over 20000 road segments. The data frame is then exported back to ArcMap, where it is merged with an updated road network using a spatial join based on ID keys to create the final LTS network where green is LTS 1, yellow is LTS 2, orange is LTS 3 and red is LTS 4.

This network will be used in a research project that seeks to understand cycling behaviour of SoBi users by modelling levels of traffic stress (LTS) against user ridership to identify whether SoBi users are cycling on road segments of low or high LTS. The modelling behaviour of cyclists will provide insight to where road infrastructure can be improved, increasing network connectivity and overall cyclist safety.
Look out for the next blog post on LTS development and its implementation on cyclist safety!