
Partially Scripted Way to Show Images Obtained from Collector in ArcGIS Online Pop-ups
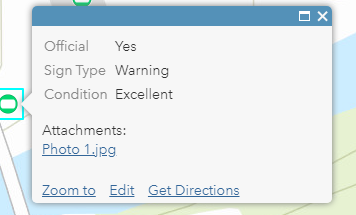
So, you’ve just used Collector to collect data, including pictures, and now you want to display those images in ArcGIS Online pop-ups for each data point, but you keep getting something that looks like this?
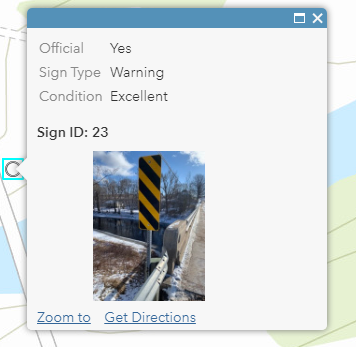
But instead want your picture displayed in the pop-up, like this?
Read on for one solution that does not involve generating tokens. Please note that it will require some knowledge of HTML, Python, ArcMap, ArcGIS Online, Excel, and Google Photos.
Please also note that this method will take a while, it is only meant for using Collector with large amounts of data and for organizations whose data is private (assuming it is fine if the pictures are public facing). If you only have a few points collected, you would be far better off clicking each link in the pop-up, saving and publishing each image to a public facing photo collection site, creating a new field for links, and copying and pasting each link in individually. However, if you have hundreds of data points and don’t wish to spend an afternoon copying and pasting, read on.
To see any images in this article larger, just click on them.
Step 1: Collect data
If you haven’t already done so, you will need to collect data using Collector, and of course take pictures while doing so.
Step 2: Export Hosted Feature Layer to File Geodatabase, and open in ArcMap
Log into ArcGIS Online, and on the contents tab find the Feature Layer that data was appended to from Collector. Click its details page. Click “Export Data”, and in the drop down “Export to FGDB”. In the pop up, you will need to give at least one tag before you can export it, you may delete the item later on so it doesn’t matter what you choose. The page for the exported FGDB will load after it has been created. Click “Download”.
Create a folder in which to store this file, and unzip the FGDB there.
Open ArcMap, connect to the folder in which the unzipped FGDB is in.
Step 3: Batch export attachments
For this step, please see this well written support article by Esri.
When picking the Attachments Table, you will need to select the file that ends with “__ATTACH”.
Do not close ArcMap, you will need to use it later.
Step 4: Upload to Google Photos
In the folder that you specified, there will now be a picture for each data point. Go to Google Photos, and sign in if you are not already. Click “Create”, and in the drop down click “Album”. Upload all photos from Step 3 to this album (can be done by dragging the folder into the album). Enable the album to be shared by clicking the 3 stacked dots in the top right, clicking options, and clicking the toggle switch for sharing. Copy the link provided. Log out of Google to ensure that the page source (more on that later) is the same for anyone who isn’t logged in with your account.
Step 5: Get links for all images on album using JSON2Links.py
Download/copy and paste this python script to a new script, and put it in a folder of your choosing. In that folder, make a text file called “pagesource.txt” (it is required that you name it this, unless you wish to modify the script).
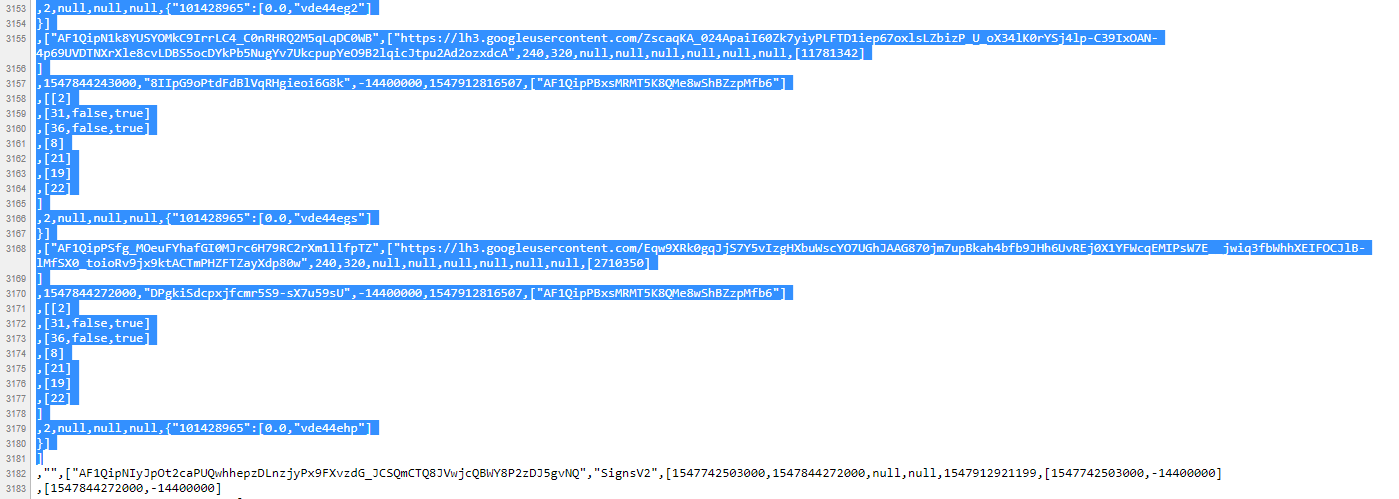
This next bit is important, and is easy to get wrong. A specific and long part of the HTML must be copied into pagesource.txt. To get the page source, right click on your Google Photos album and click “View page source”. After scrolling down a few hundred lines, and slightly after some code regarding a script for an event listener, there will be a script containing all the links. You must copy from the first “[[” to the last line including a link for a picture (right before a part that includes the album name). These instructions are quite vague, so use the page source from my Google Photos album and the following pictures as a reference.

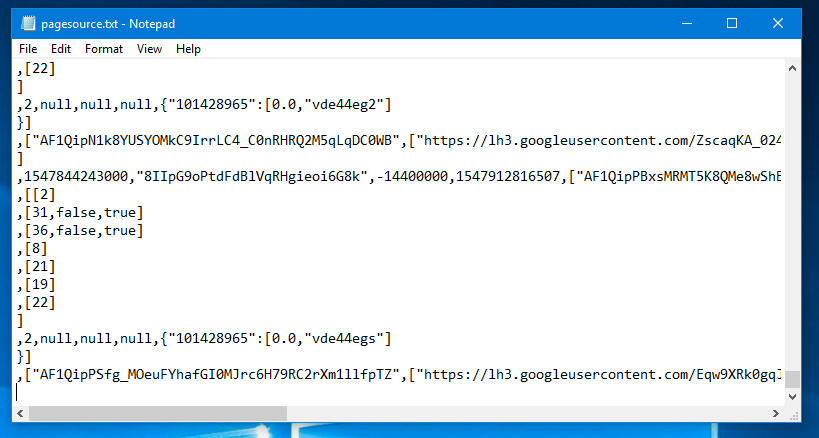
Next, copy and paste all that text into pagesource.txt.
Next, save pagesource.txt, and run JSON2Links.py. In the shell, all links will be extracted, as shown in the image below.
Step 6: Prepare links and ID’s in Excel
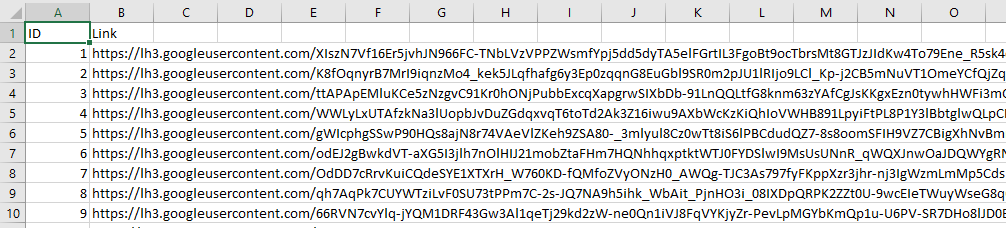
Go back to your Feature Layer on ArcGIS Online. Export to a CSV by clicking “Export Data”, and then clicking “Export to CSV file”. Again, you will need to include a tag. A page will open, download the CSV. Unzip the file in a folder of your choosing (though it would be easier to put in the same one as the FGDB from earlier). Delete all headings and data, except for the header OBJECTID and its corresponding data. Rename OBJECTID to just ID Make a new header called Link, and copy and paste the output from Step 5 into this column.
Note that is necessary to export the CSV from the Feature Layer to obtain the Object ID’s, as just having 1 to the total number could result in errors, as Object ID’s can skip if you either deleted entries or discarded entries while using Collector.
Step 7 (optional, but recommended): Photo verification
An unfortunate shortcoming of this technique is that so far, this depends on Google Photos to show the pictures in the correct order. It is possible that Google Photos can swap the order of them during upload, especially in large quantities. There are two ways to combat this. One, is by manually going through each image on your Google Photos album and the “supposedly” corresponding image in the output folder from step 3, and confirm that each matches up. Where there isn’t a match, you will have to fix the appropriate links in the CSV from step 6.
The other method involves running the third and final Python script discussed in this article. PictureVerifier.py uses the output folder from step 3, and the CSV from step 6. It downloads each image from the link in the CSV, and compares it to the picture in the output folder at the same position by computing the difference in their histograms. Unfortunately, the image quality differs slightly after downloading from Google Photos, thus causing differences of non-zero for matching pictures. When comparing 240 x 320 pixel images, matching images tended to be ~0.03, while non-matching images ranged from ~ 0.1 – 0.3.
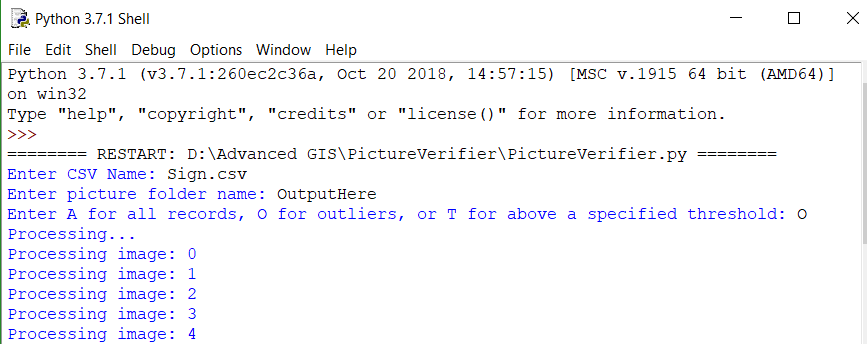
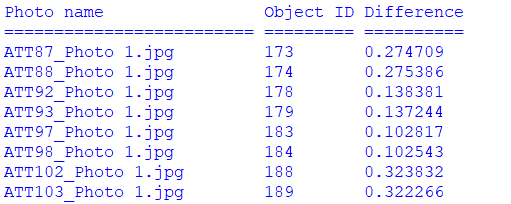
To use this script, you will first need to install modules Pillow, Image, and numpy. Next, the script must be in a folder with the CSV, and the output folder. Next follow the prompts to enter in the appropriate file and folder names, as well as which reports you wish to view. The options are A for all, O for outliers (anything with a difference over the mean plus one standard deviation), or T for a threshold of your choosing. Program will print the number of image pair it is currently working on, followed by all the relevant reports. Reports include the image name in the output folder, the “supposedly” corresponding ID in the CSV, and the difference. After determining which images have been swapped, adjust the links in the CSV accordingly.
Step 8: Perform join and export as shapefile
Go back to ArcMap. Sign into ArcGIS Online (File -> ArcGIS Online…), click “My Maps and Data”, and find your Feature Layer. Open it in ArcMap. Right click on it in the contents pane, click “Edit Features”, and then “Create Local Copy for Editing”. This will take a moment to load.
Load the CSV file from Step 6 into the map. Right click your layer from the Feature Layer, and click “Join and Relates” and then “Join…”.
In the pop up, join the OBJECTID on ID, as shown in the following picture:

Right click on the layer again, click “Data”, and then “Export Data”. I chose to export as a shapefile, if you wish to use another file type that is fine, but these instructions are for shape files. Output the feature class to a folder of your choosing, and zip up all of the files created.
Step 9: Upload shapefile to ArcGIS Online
Go the Content tab of ArcGIS, and click “Add Item”, and then “From my computer”. Choose the zipped up shapefile, and give it a title and tag(s). This shapefile will contain the geography and all attributes including the link text. It will not include the image attachment themselves.
Step 10: Finalizing and cleaning up
Congratulations! You’re done. You can finalize this by presenting your pop ups however you wish. To show the picture in the pop up, add an image to the pop up media and set the URL to the Link data.
ArcMap can be closed without saving, and intermediate CSVs, textfiles, and FGDBs can be deleted on your computer and from ArcGIS Online, where appropriate. The only thing you need to keep is the shapefile in ArcGIS online. You can drop the ID field if you wish, as it is just a copy of OBJECTID.
Thank you for reading this article. I hope it was useful!