
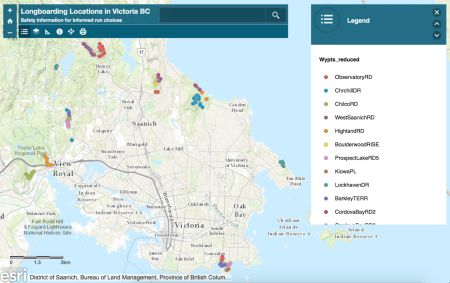
WebApp for Longboarding Locations in Victoria, BC
This project was prepared by Trilby Buck (4th year Geomatics student) for an advanced GIS course at the University of Victoria under the supervision of Robin Kite.
Background
All too often longboarders are involved in serious accidents at higher rates than skateboarding (Fabian et al., 2014). This is because longboarders most often share space with vehicles. Our transportation roadways are usually seen from a ‘car-centric’ viewpoint with limited bike board lanes. To decrease risk of injury and increase accessibility to the sport we need a way to make shared vehicle space safer.
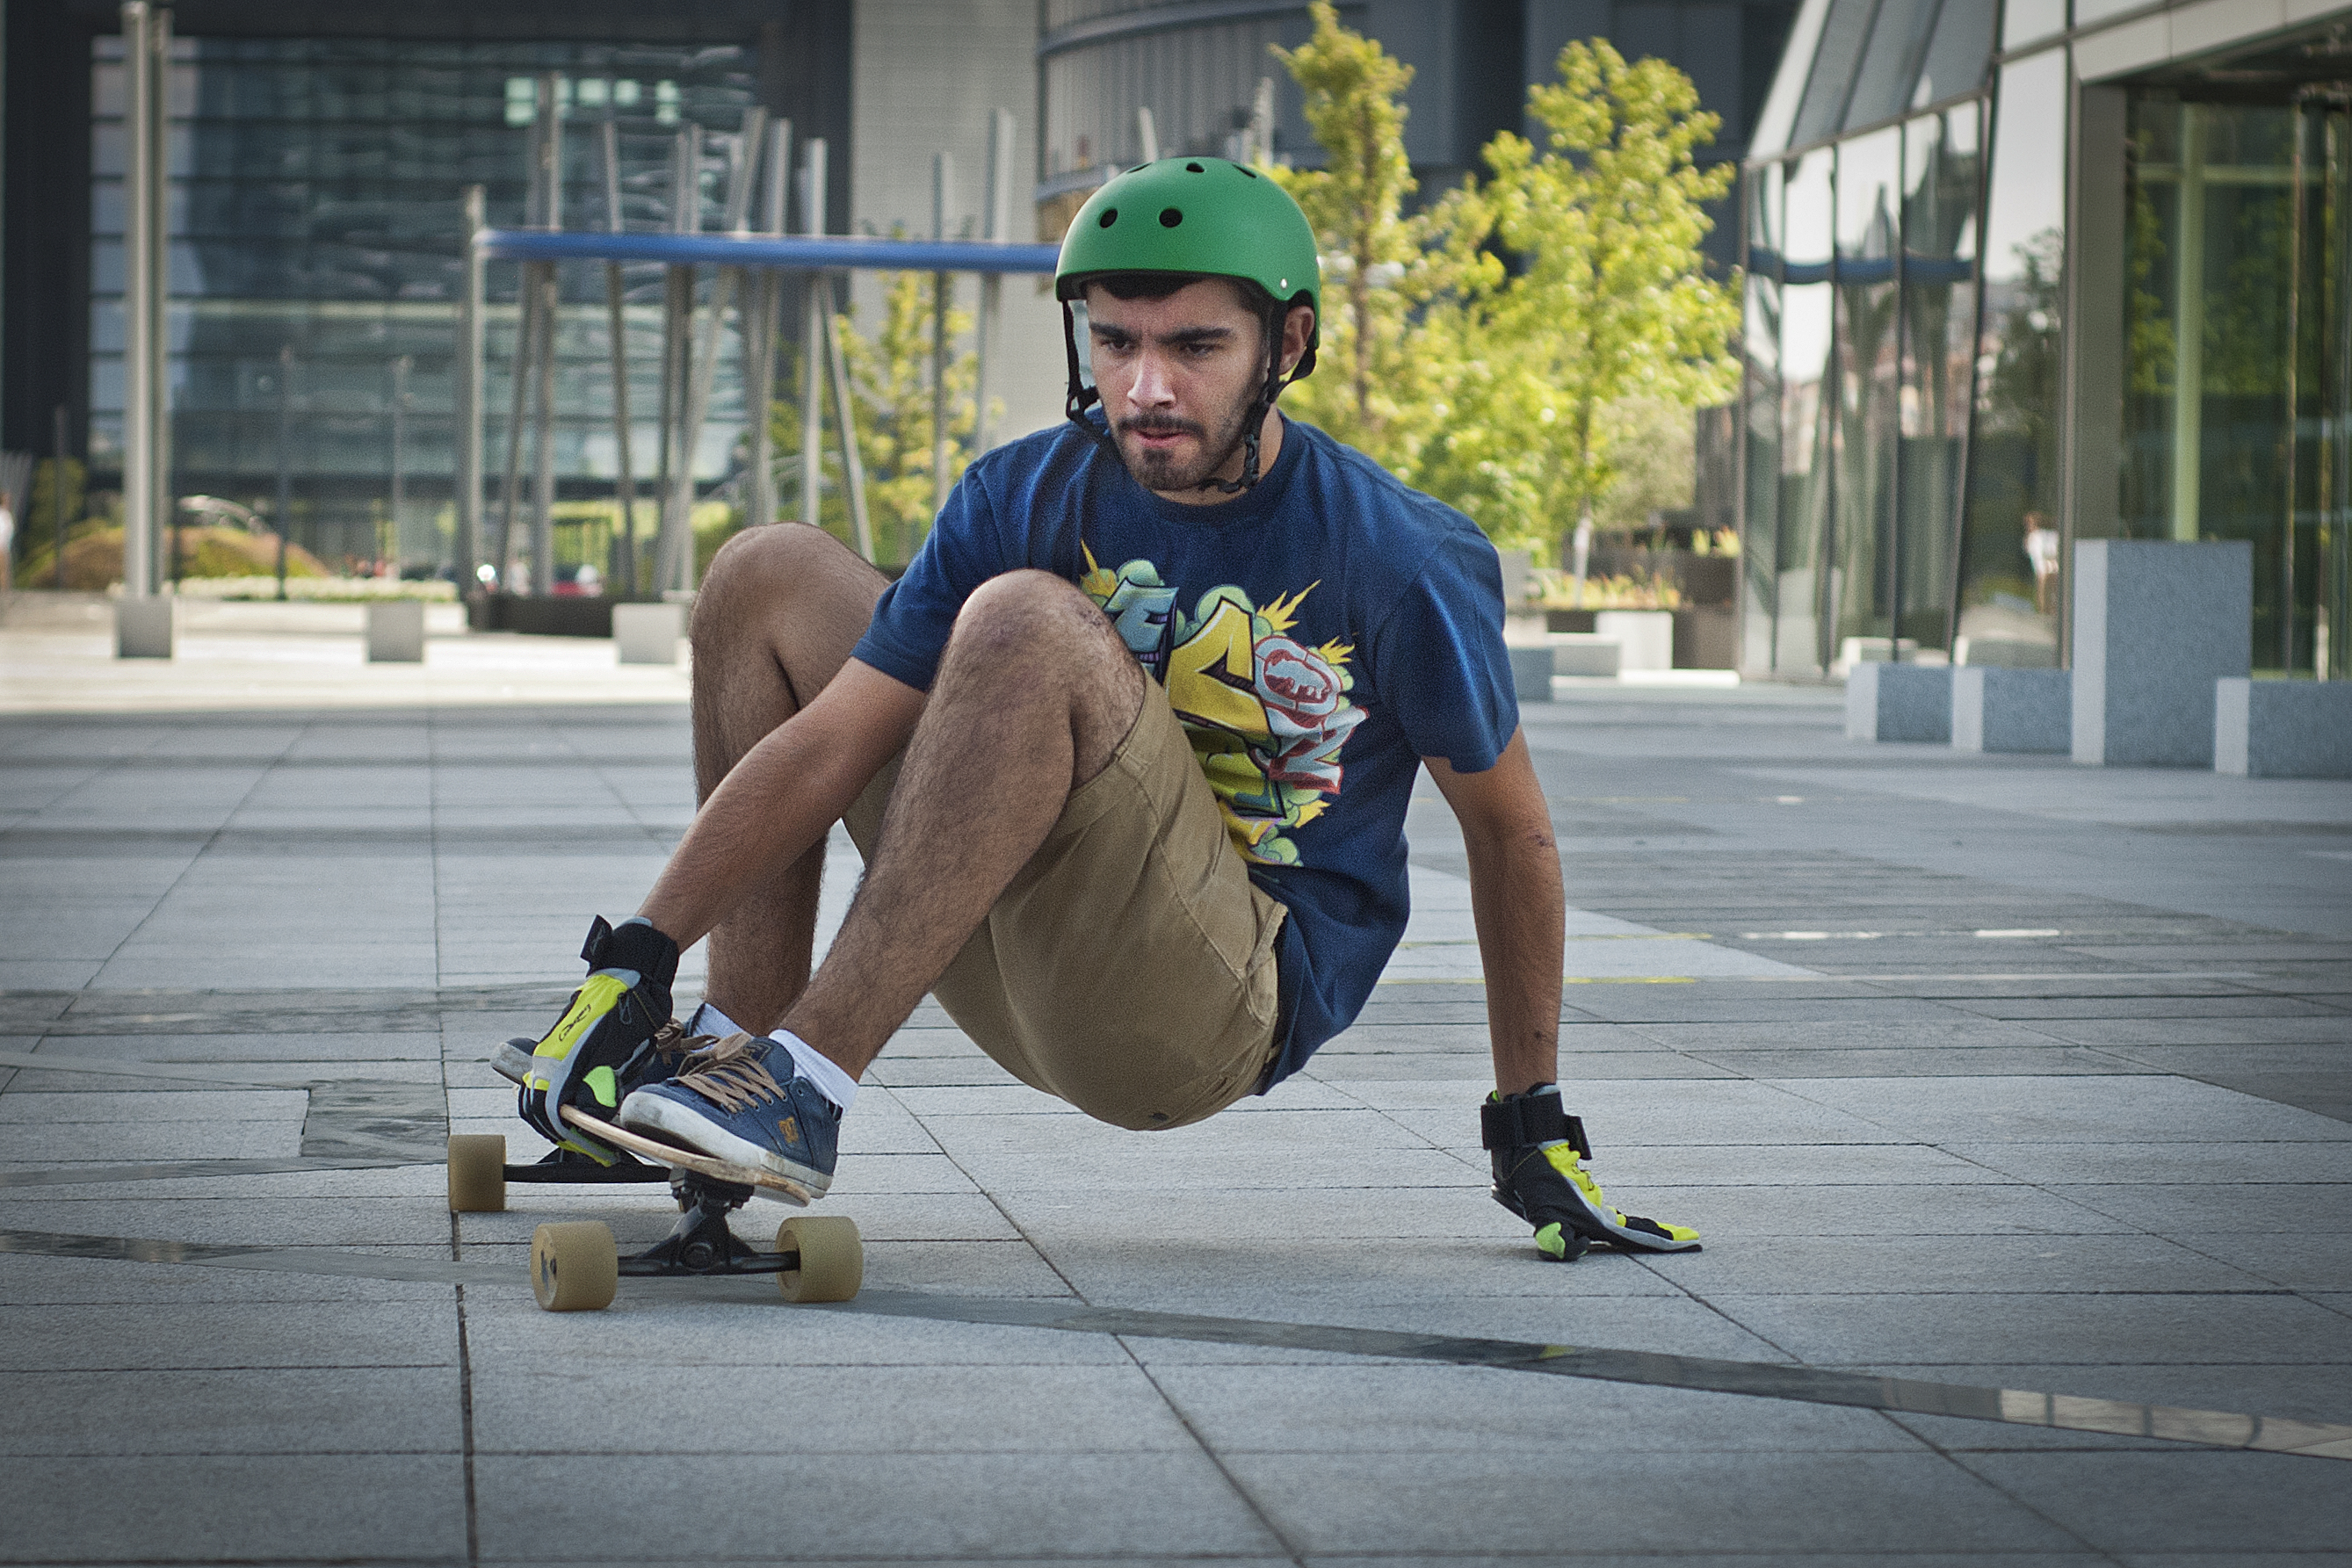
I rode a bit in high school but felt intimidated once I came to Victoria because I didn’t know where I could go with my limited skills to learn and improve safely. So I decided to use my final project in advanced topics in GIS to provide information in an accessible way to people like myself. In this way people could get information about areas that were suitable for their skill level and encourage people to feel safer with the sport.
There’s already a mobile app out there that kind of does this. It’s called Longboard Mapp and it requires users to record routes, which others can then search based on difficulty level and type of riding. This is a really cool application, unfortunately it just doesn’t have much data outside of America. I think there are maybe two runs users have made for Victoria, BC. What I decided to do was go about the problem from the other direction: find the locations for the user and provide them in an Esri Web app.

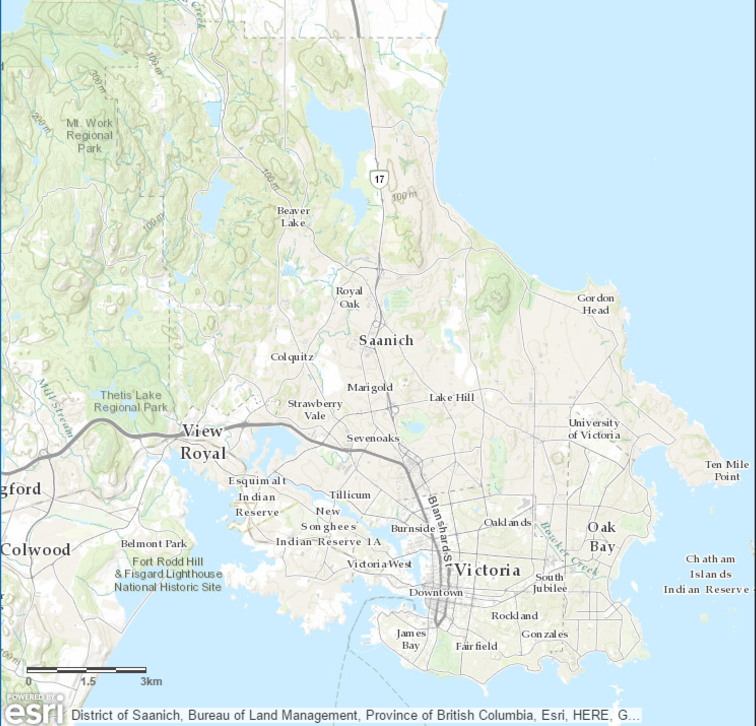
Study Area
The study area included the Greater Victoria area in BC from Esquimalt to Central Saanich and everything to the south east. I chose this area based on how far I would personally travel for an afternoon or evening of longboarding.
My initial plan was to do a suitability analysis. I would use elevation, pavement, sinuosity and traffic data to find the suitable locations. Then I would make that into a web-map. No matter where you were, you would be able to go online and access the information. At the top of the run you could look and see if there were any safety features further down to be concerned about. You could find areas where there was a high concentration of runs and head there for the day. The opportunities seemed endless.
The reality was that data were inaccessible for the timeframe and scope of my project. I could create steepness from a DEM and the road network using slope analysis but that was really it. So after reconsidering a new plan was made to create a dataset myself.

Methods
- Find roads using slope data
- Create dataset
- Turn into WebApp
Data
- DEMs, 19m resolution, BC government
- Roads, Statistics Canada
- Census Subdivisions, BC Stats
In order to find good boarding hills I used ski slope classifications to determine what was a beginner, intermediate, advanced and expert run.

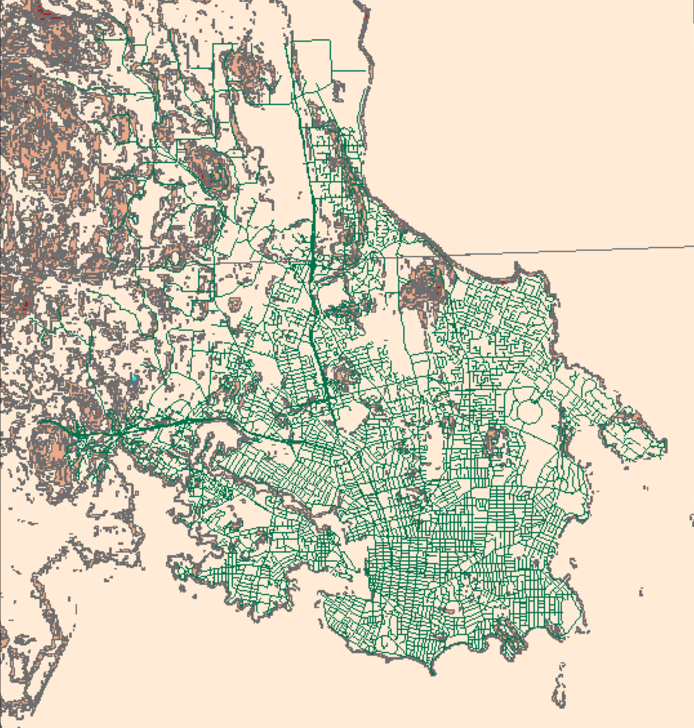
The slope tool was then used to create a raster layer with slope values based on the skiing slope classification. These were then converted to polygons using raster to polygon, and joined with the road network so that each section of road would have a slope ranking of 1-4 associated with it.
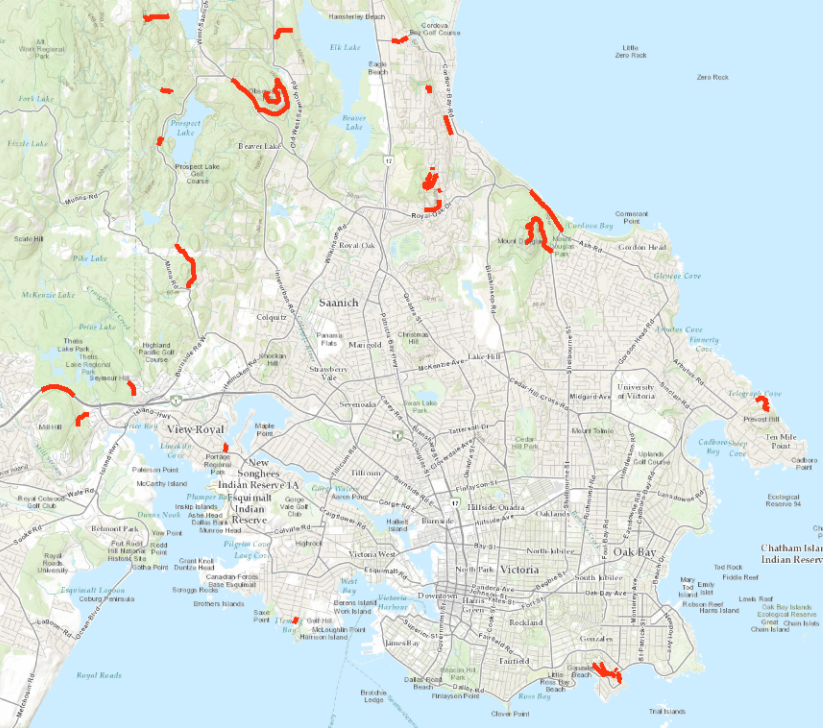
There were 2 double black diamonds runs, 31 black diamond runs, about almost a thousand blue square runs and 7000 green circle runs. I selected black diamond and double black diamond runs since these would have slope desirable for longboarders and time constraints prevented me investigating thousands of runs. The road segment outputs are below. For the purpose of this project I call them runs through in reality they may not have a clearly defined start and end that aligns with the road line segment.
Data collection in the field consisted of visiting each location with a GPS and taking waypoints at significant safety features. This was collected over two weeks, and at 33 run locations. Points were taken at the start of the hill, every corner, any safety concern features and the end. At each point the following data was recorded:
- Pavement condition – (Poor, Ok, Good)
- Sinuosity – (Easy, Medium, Advanced)
- Traffic level – (Low, Busy, Hectic)
- Safe runout – (Yes / No)
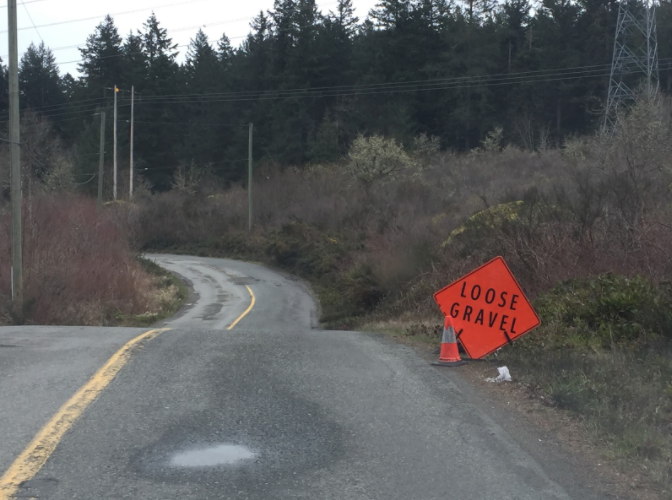
- Safety concerns (i.e. debris on the road, intersections)
Creating the dataset
The GPS coordinates were uploaded using GPSBabel then brought into Excel. Once the locations were formatted and erroneous points removed, the data was brought into ArcMap and converted to a shapefile. This shapefile held the information for the accessible hills that have rideable pavement in various conditions for the runs identified by the initial slope analysis.
Results
The slope analysis gave 33 sections of road and after seeing them for myself I determined there were in reality 38 runs with a clearly defined start and finish from uphill to down. Out of those 38 that there were 27 suitable runs in terms of length, pavement, road safety and accessibility. This resulted in a dataset with information on pavement condition, sinuosity, traffic level, whether there was a safe runout and any other safety features for the 38 runs. Other safety features included whether the road was narrow, if there were blind corners, cracked pavement or debris on the road.

Limitations
The slope analysis produced locations based on suitable slope alone. However once reaching the sites, many were not suitable such as highways, people’s driveways, and even one bike lane.

Slope classification was also susceptible to the resolution of the DEM which in one case classified a relatively flat slope in the steepest category
because it was situated beside a cliff. The start and end of the road segments in the analysis did not always match with where you would logically start on site but rather had undulations. Some of the locations would not be readily accessible, as many longboarders are urban based, dependent on a public transit service. Even for those with a car, the distance between locations is large enough to deter driving to some sites.
The slope analysis with just a DEM and road networks is really only useful if someone goes and checks out the sites for pavement condition. This introduces a subjective opinion of the suitability of the sites.
If a web app is a useful way to disseminate this information, a future step could be to look at improving the usability of the app by allowing users to contribute data (Sui et al., 2012). Particularly, pavement conditions were one of the most important factors run run usability, and also the hardest to access data about. This would also reduce data collection time. It would be great if users could upload their own runs, or review the ones already collected.
Conclusion
Longboarding is sport with inherent risk because it occurs in shared space with cars. Having information that is relevant for longboarders can help riders make safer decisions about where to ride based on their ability. This project identified and collected data from locations that were selected based on a slope analysis in GIS.
It is useful to have the data collected at these sites in a web-map so people can access and visualize the data from remote sites. In the future, to improve the usability of the web-map, volunteered geographic information may be investigated as a method to create more data relevant to longboarding.
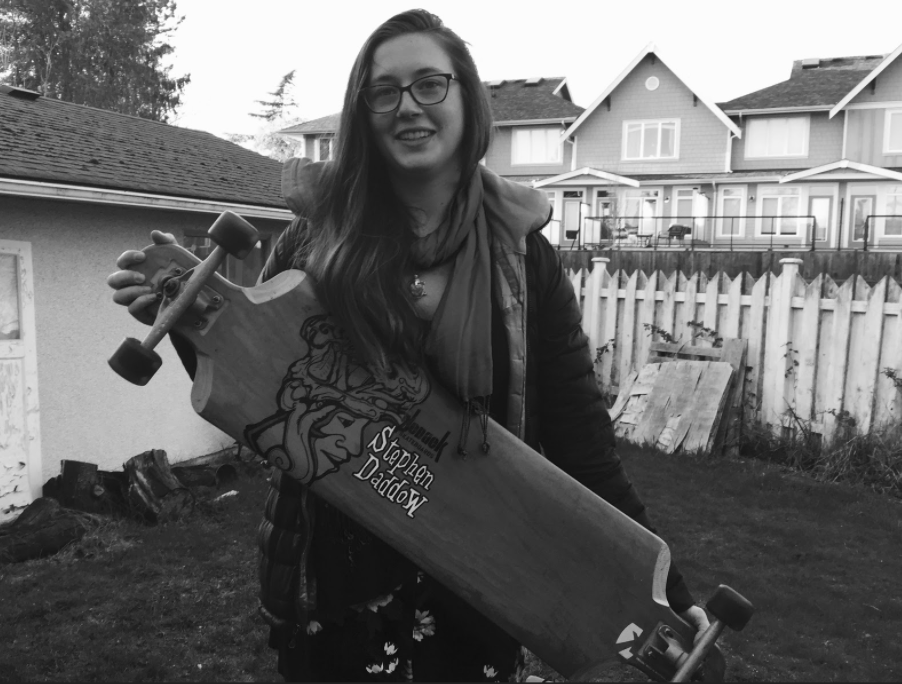
Trilby Buck
References
Fabian, L., Thygerson, S., Merrill, R. (2014). Boarding injuries: the long and the short of it. Emergency medicine international. 4, 924381. Retrieved from http://www.ncbi.nlm.nih.gov/pubmed/24660063
Shealy, J., Ettlinger, C., and Johnson, R. (2005) How Fast Do Winter Sports Participants Travel on Alpine Slopes?, Journal of ASTM International, Vol. 2, No. 7, 2005, pp. 1-8, https://doi.org/10.1520/JAI12092. ISSN 1546-962X
Sui, D., Elwood, S., & Goodchild, M. (Eds.). (2012). Crowdsourcing geographic knowledge: volunteered geographic information (VGI) in theory and practice. Springer Science & Business Media. Retrieved from https://books.google.ca/books?hl=en&lr=&id=SSbHUpSk2MsC&oi=fnd&pg= PR7&dq=vgi&ots=J4Yw9FzCc9&sig=KzaZ99edrEN976M8vFDhh7rpSGg#v=o nepage&q=vgi&f=false