
Automating Suitability Mapping with ArcPy
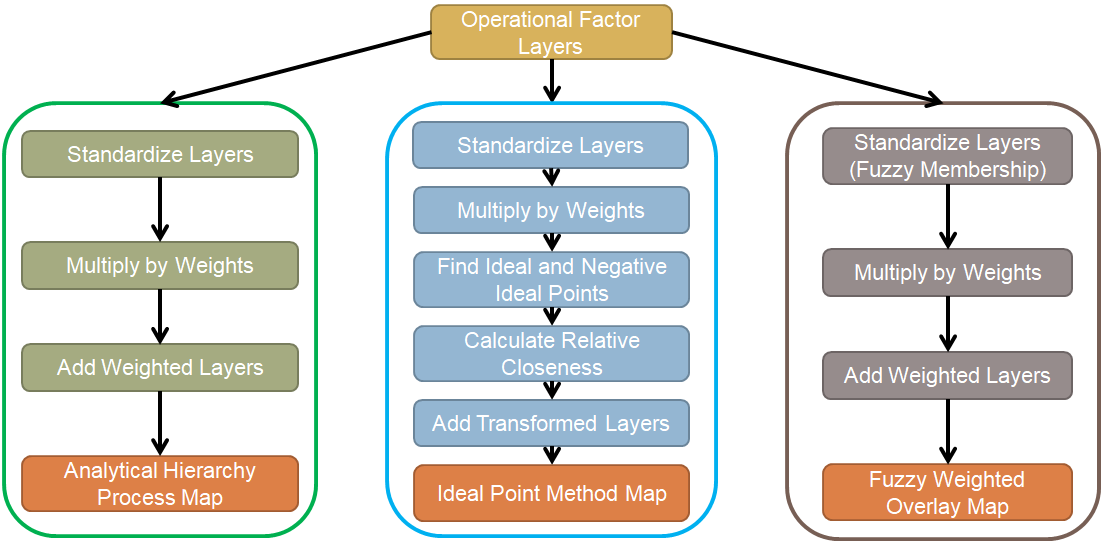
For my undergraduate thesis last year, I created maps representing susceptibility to calanchi erosion in the Basilicata region of Italy using 3 different Multicriteria Decision Analysis (MCDA) decision rule techniques. All of these procedures involve several repetitive steps that could have been automated by a Python-based tool, but I didn’t have any experience with programming whatsoever at that point.
Since then I’ve taken a 1st year Introduction to Programming course, played around with Python and ArcPy during my summer work term at Agriculture & Agri-Food Canada, and am now finishing the 4th year GIS Programming course here at Mac. I thought our final course project would be a great opportunity to try and automate some of the tasks involved in suitability mapping, with the goal of eventually carrying this over to most or all of the MCDA techniques used in my thesis.
In our 3rd year Advanced Raster GIS course, we used a basic form of MCDA to find suitable campsite areas in Gifford Pinchot National Forest based on 5 conflicting criteria. I used this as a test case to build my tool around, although there are a huge amount of potential applications.
For each criterion under consideration, there needs to be 3 user-defined inputs: the raster datasets representing factor layers, their weights (expressed as percent influence), and their standardization procedures. These can easily be hard-coded into the script, but this project required that we make it into a flexible user-friendly tool that can be directly executed in ArcMap. Through the Multivalue tool parameter property, the user inputs are passed to the script as semicolon-delimited strings, which can be easily split into indexable list objects and iterated through. As this gives no limit on the number of inputs, the tool can be used for suitability analysis with any number of criteria.
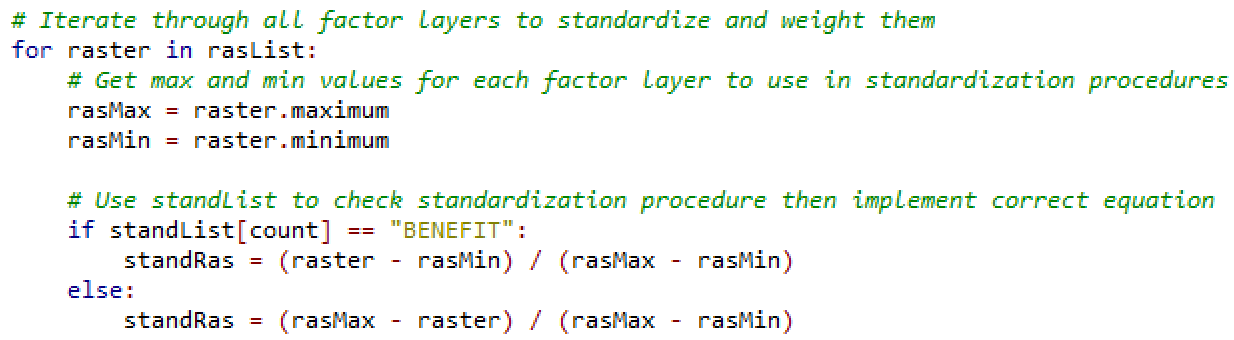
A good example of how much more convenient Python scripting makes this process is criterion standardization, where each factor layer representing criteria under consideration must be transformed into a factor layer with arbitrary units ranging from 0 to 1 based on their suitability. This was done using the Score Range procedure, which requires each raster’s maximum and minimum values and uses them in one of two formulae, depending on whether the factor under consideration represents a cost or benefit criterion.
During my thesis, I had to manually copy all of the factor max and min values into the Raster Calculator in ArcMap and perform each Map Algebra expression individually. In my Python script, however, I used the raster.maximum and raster.minimum raster object properties to retrieve these automatically. Then a simple if/else statement was used to check what standardization procedure was specified by the user so that the script could execute the correct formula, as shown in the code sample below.
After the layers were standardized, they were multiplied by their respective user-defined weights and added together to create the final suitability map.
Next semester, I’ll be expanding on this work through an Independent Study with my thesis supervisor Pat DeLuca. The plan is to create 3 different scripts that automate each MCDA susceptibility model that I used for my thesis, so that the only manual work needed is to specify the predisposing factor layers, weights, and standardization procedures. I’d also like to be able to automate some of the steps in preparing the factor layers, such as applying constraints and making sure they all have the same spatial references and extents. In theory, if I can get good enough at Python, I can even automate the pairwise comparison matrix in Microsoft Excel to automatically generate criterion weights and check their statistical validity.
By automating the most time-consuming parts of all 3 MCDA techniques, I should easily be able to improve my susceptibility models and apply them to other regions in Italy that are heavily affected by calanchi erosion (Toscana, Abruzzo, etc.) and compare the results with the original study area of Basilicata. As the only real limits to this project are my own programming skills, I’m excited to get more experience with ArcPy and Python scripting in general and see how far I can take this.