
Where is the Centre?
Early this year one of my professors approached me and several other students to take part in a project that had to do with Ottawa. As the 150th Anniversary of Canada was looming in the not so distant future he’d been approached to cover the topic of what the centre of Ottawa really was. But here was the rub… centre of what?
Exactly that… centre of what? So, tasked with this daunting challenge we got together and hunkered down to figure it out.
Brainstorming we came up with some early idea’s on what could be seen as the ‘centre’ of Ottawa.
Seat of Power (Parliament), Financial Centre (Downtown core), Cultural Centre (the Byward Market/Rideau Canal)…
Educational, Residential, Spiritual, the list went on. It became clear that the idea of a ‘centre of Ottawa’ wasn’t something so clear cut. Throughout this process we ignored Hull, but had we incorporated this area into our process we would’ve seen big changes.
Gathering data and booting up ArcMap took us to our next step, away from the conceptual into the spatial. We looked at Census tracts (2016 Data), neighborhoods, burrows, population, density, roads, transit. The idea was to look at as many different ‘centres’, analyze their distribution and make a decision.
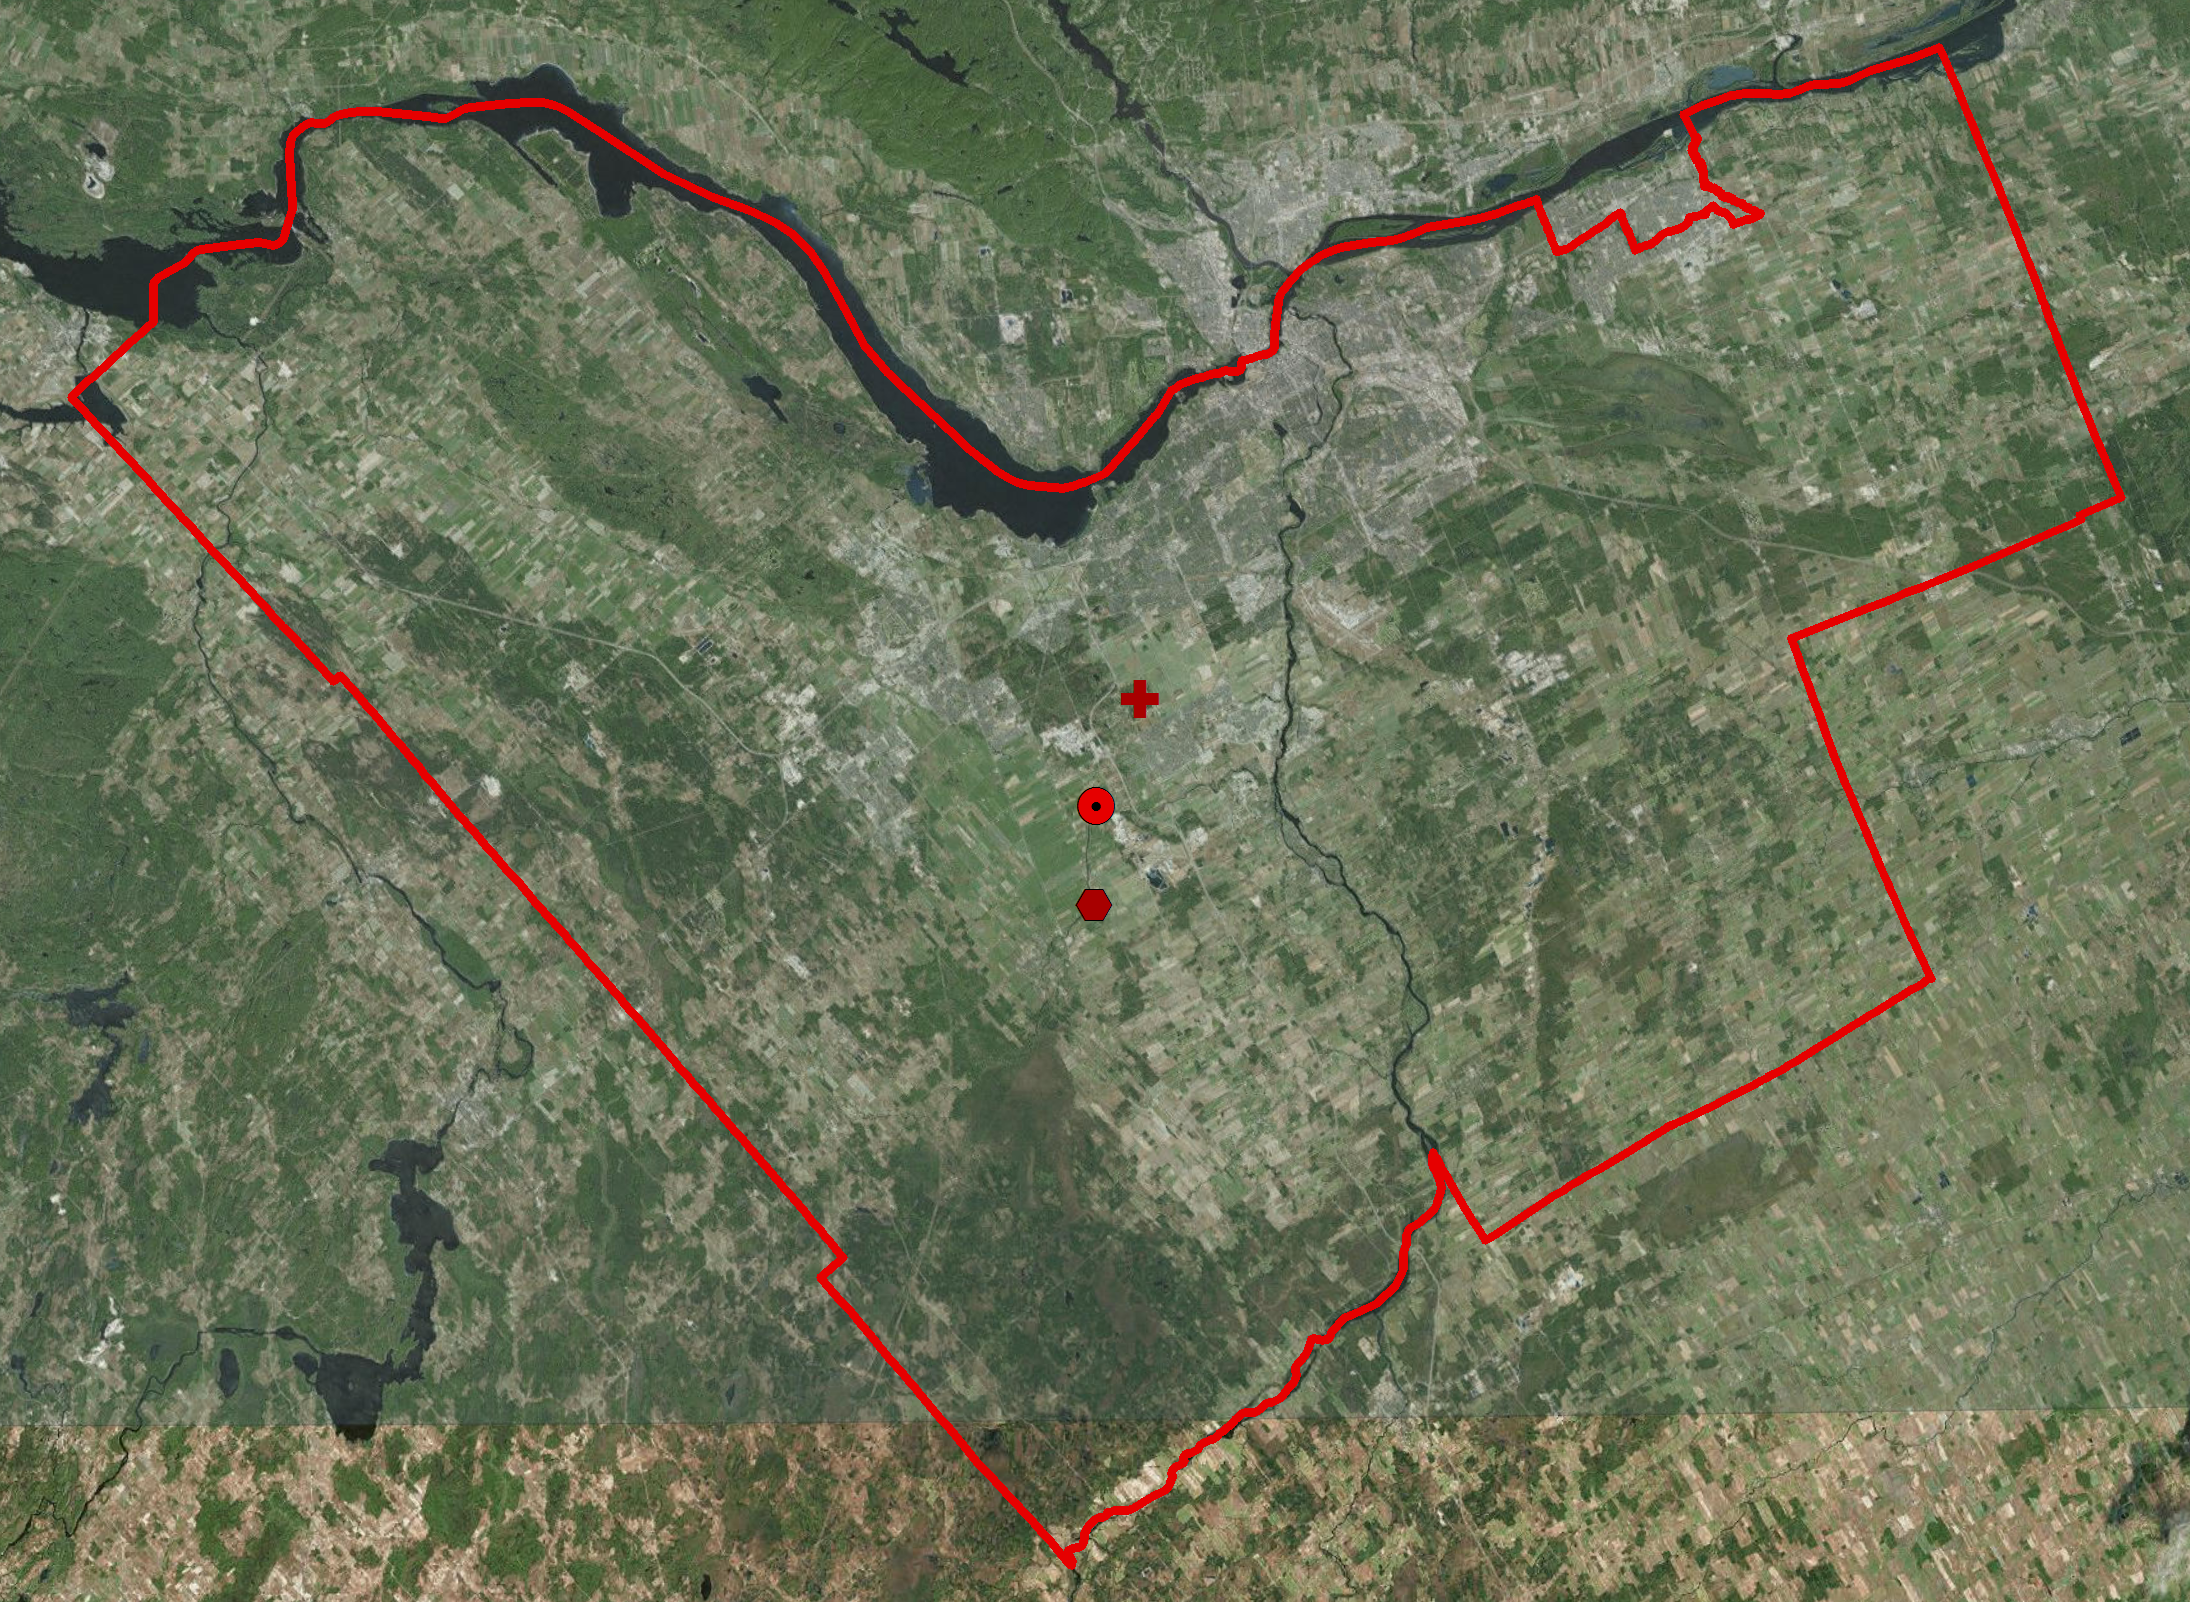
The above image is the extents of Ottawa, the boundary that we set. Inside you can see 3 point features that represent our most likely centres.
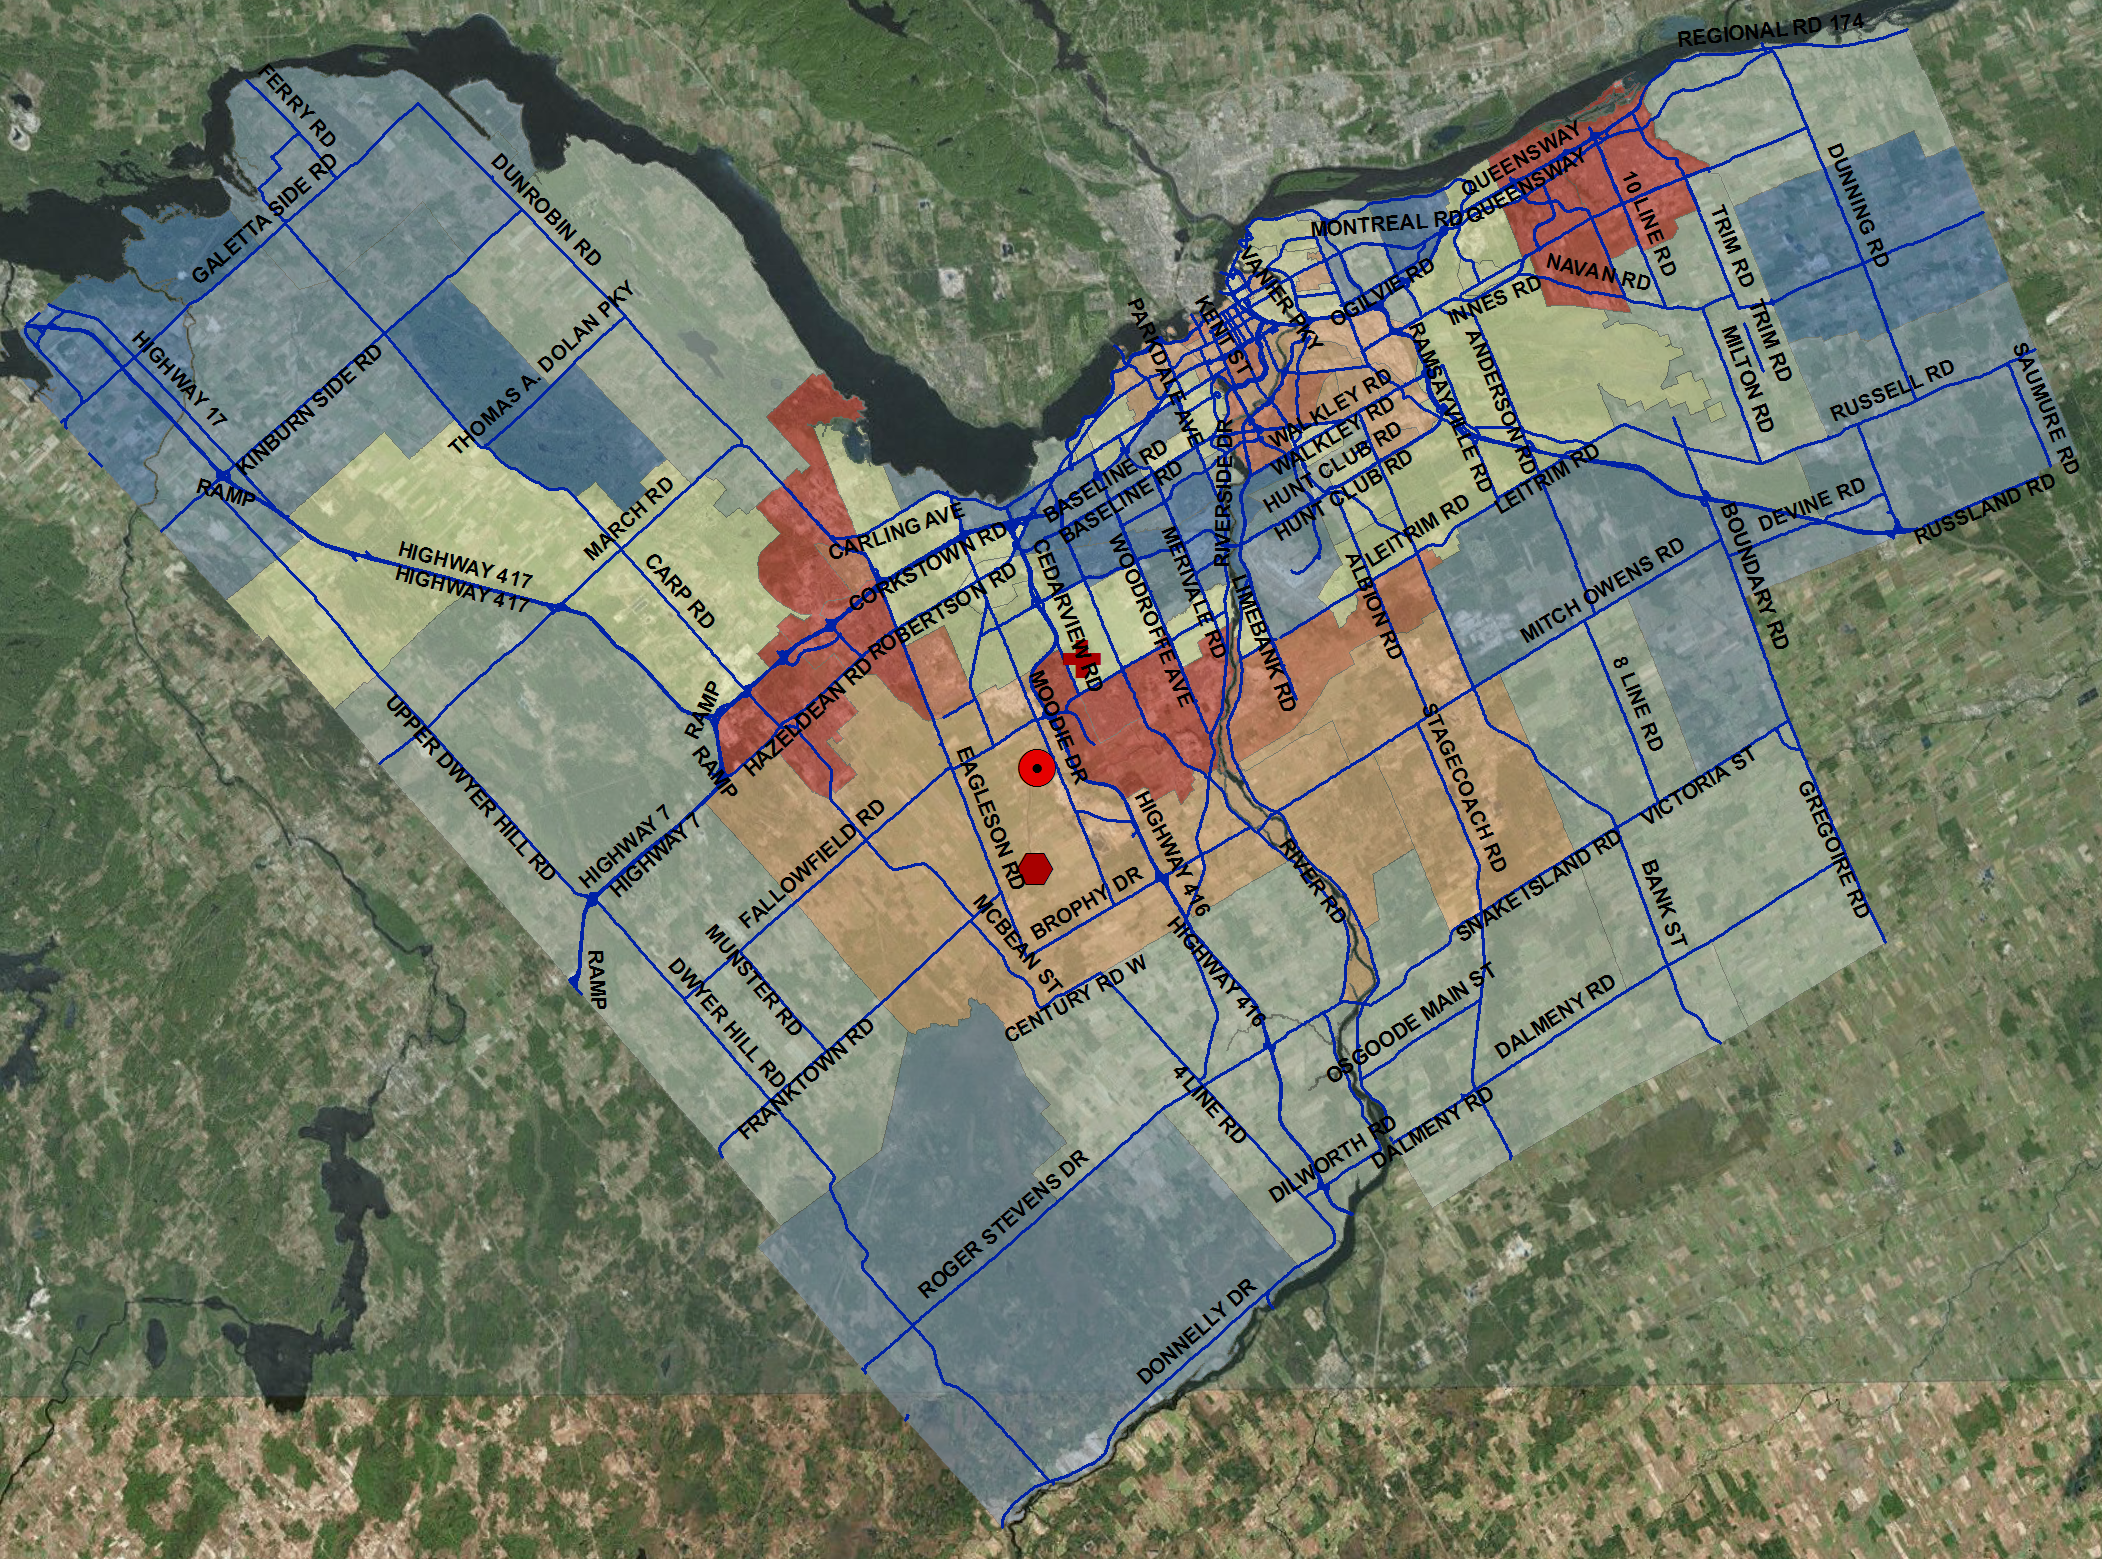
This image has our Census Tracts and is symbolized representing population density per tract. Our first centre was based on these densities.
You’d think that the centre would be more downtown, that is where everything in the city occurs. The population might enjoy the hustle & bustle, but they’d rather live in Orleans, Kanata and Manotick.
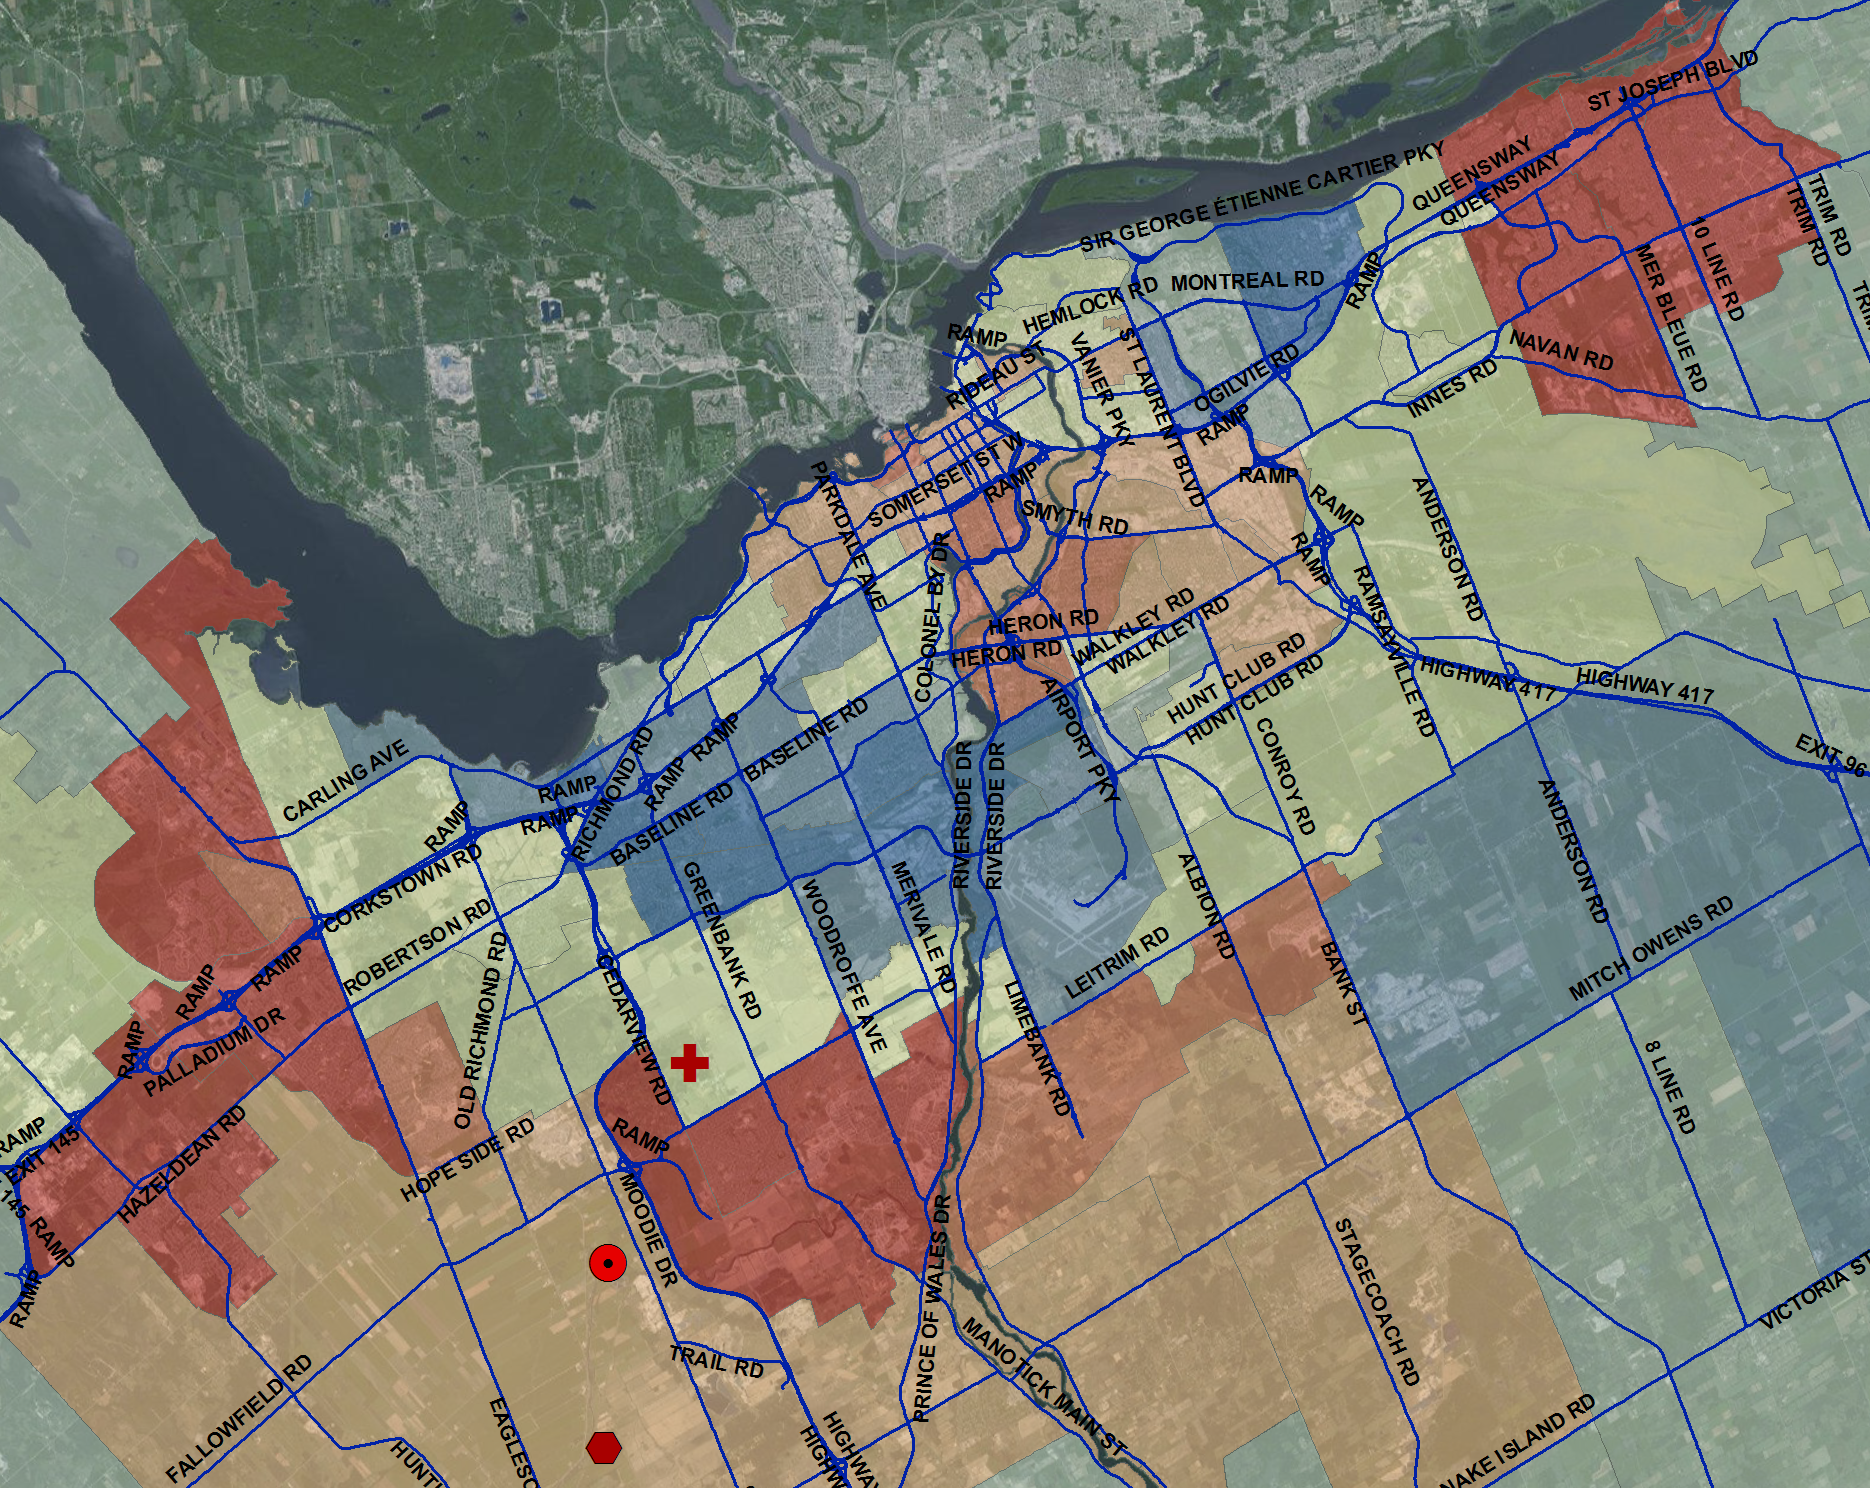
Next we looked at the road networks, they connect us, so getting from here to there would be a good representation of our distribution?
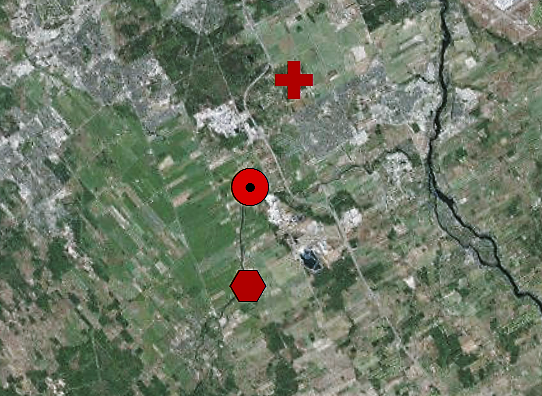
The Red Plus symbol represents the Population Density Centre of Ottawa, the Red Circle symbol represents the Road Network/Transit Centre of Ottawa and the Red Hexagon symbol represents the Forecasted Centre. They all seem pretty clustered in southern Ottawa.
We lastly tried forecasting where the ‘centre’ would be once we incorporate Aylmer and other communities that we felt would be merged into Ottawa with its expansion over the next 10 years+. The idea was that as Ottawa would need more area it would merge outlying communities and shift the ‘centres’ positions. Our professor did all the math, and came to the forecasted ‘centre’.
We took our data, maps & all, and set out to the field to take a look at the different ‘centres’ of Ottawa. When we reached our final location, the forecasted centre, we were surprised it’s by the location. In the middle of a field within 200 meters of a dump. Not the picturesque scene one would want on a 150 Anniversary post card.
This entire process from start to finish brought to mind how vital information is and how we manipulate it can affect the outcome. None of us thought we’d be standing in a field waving a Canadian flag while dump trucks sped by us and the smell of a dump drifted towards us. But what the heck, you never know where the data will lead.
![]()