
Transit Orientated Communities: A BA Group Co-op Showcase

My name is Harry, and I am currently on my third co-op term working as a Spatial Data Analyst with BA Group’s GIS team. BA Group provides transportation planning and engineering services to public and private organizations for the movement of people and goods in urban environments.
The primary focus of my work revolves around conducting reach analyses for various pedestrian, cycling, and transit networks. By understanding a community’s level of geographic access offered by existing infrastructure and services, we can quantify the impacts of proposed service changes and determine how we can improve future site accessibility to other locations and points of interest.
Transit Reach
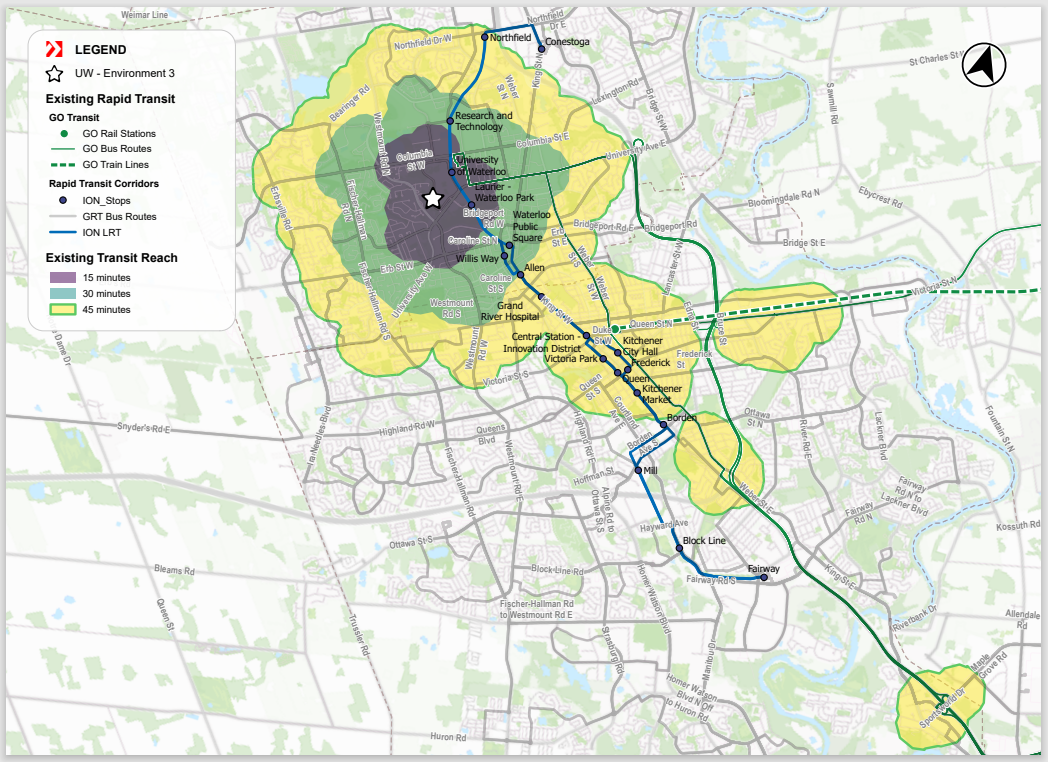
For knowledge sharing purposes, I’ve created a transit reach map that demonstrates how far you can travel from Environment 3 in approximate 15-minute intervals based on existing bus and rapid transit lines from general transit feed specification data (GTFS), which can be found online and built into a network dataset. As a brief overview: you can reach all other parts of campus and the surrounding areas, such as Waterloo Park, within 15 minutes, the Research & Technology Station and Uptown Waterloo within 30 minutes, and downtown Kitchener (and as far as Sportsworld Station) through the ION LRT and the GO Bus in 45 minutes.
Web App Development
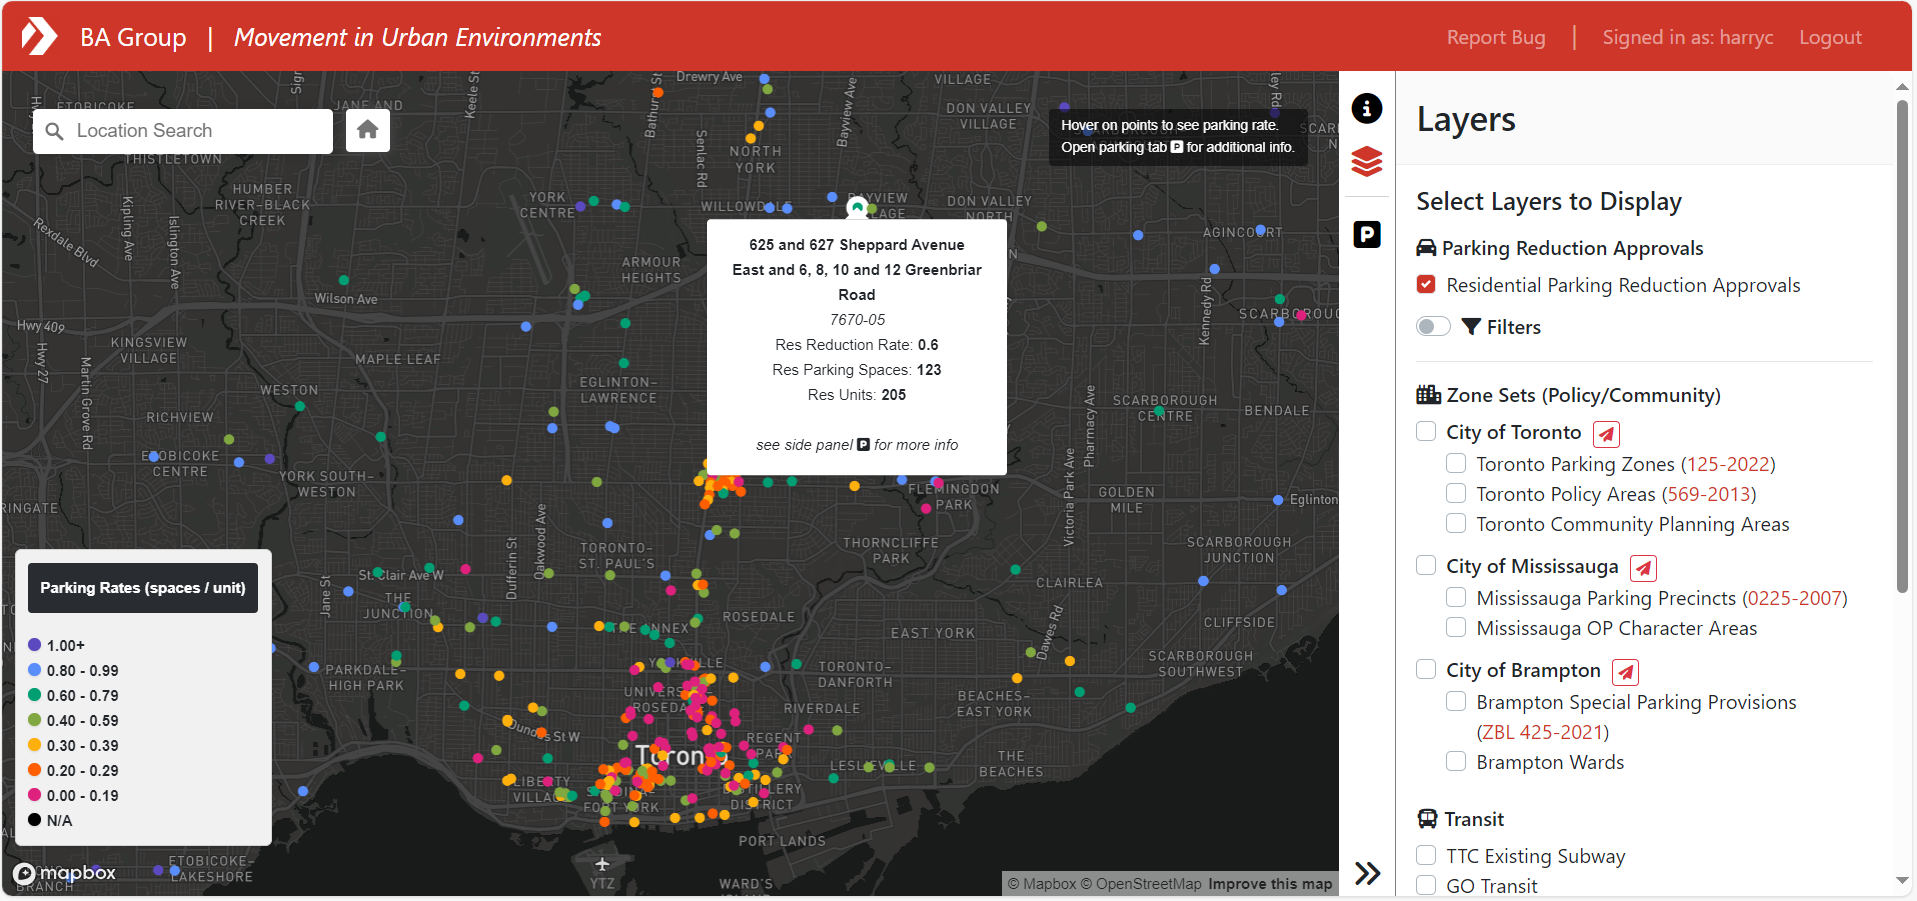
I also focus on contributing to various research & development (R&D) initiatives, which includes working with big data, developing web mapping applications, and creating scripts and methods to automate existing workflows. Unfortunately, I’m not allowed to share too much, such as the quality-of-life automation scripts I’ve developed or the web app project I’m building, as the content is either not yet public or for internal use only. However, I’ve attached a page similar to my web app from the company website displaying residential parking reduction approvals throughout the GTA.
ArcGIS Experience Builder
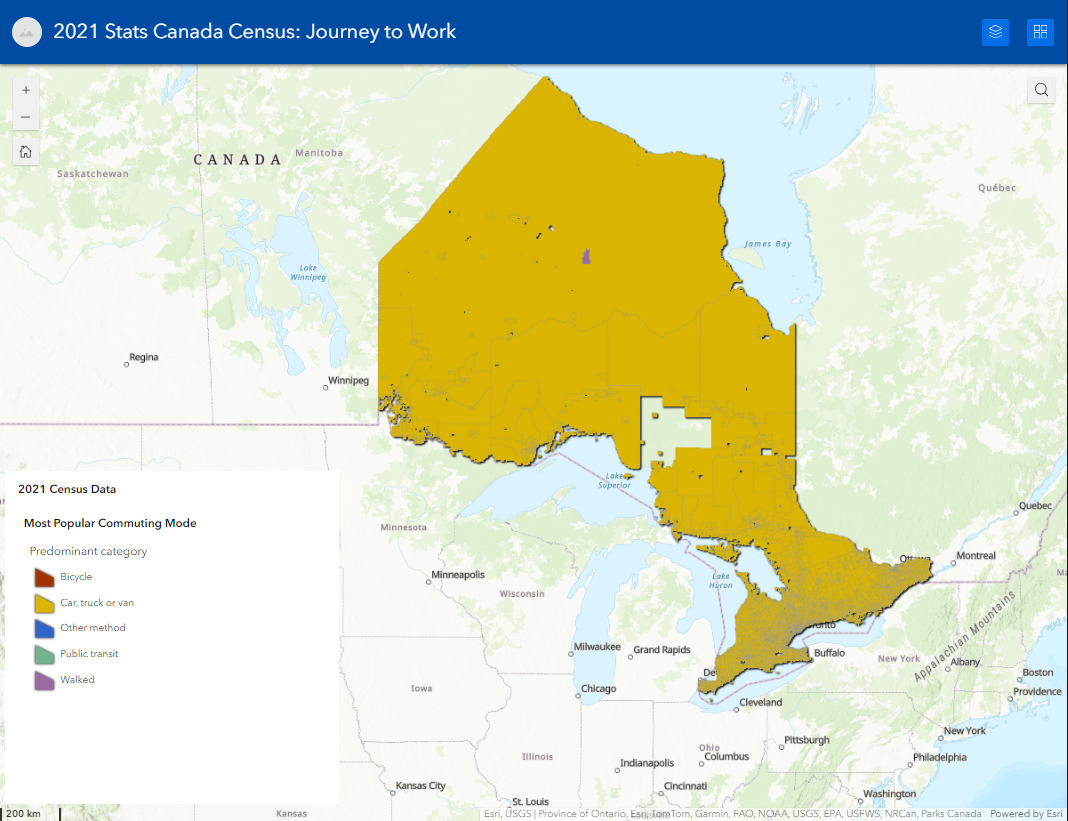
I’ve also included a snippet of an R&D visualization project I’ve been building in ArcGIS Experience Builder based on the 2021 Canadian Census Labour and Journey to Work dataset, which focuses on employment and occupational demographics. The current map layer reveals the most popular commuting mode by dissemination area, and a dominant trend can be clearly derived from the imagery.
Why Care?
Ultimately, the results and implications from our work, whether it be legal, functional, social, or economic, are critical in informing present and future sustainable development of the communities and cities we live in.