
Developing a Map-based Web Tool using ArcGIS for my Masters Thesis
Background
As part of my master’s thesis research project, titled, “Infill Planner: A geo-questionnaire to gather public input on infill developments”, I developed a map-based tool/app as a data collection method for the research. I would like to share a broad overview of how this was done.
I named the tool that I developed Infill Planner (IP). IP can be described as a geo-questionnaire. It is a multi-page web-based tool consisting of two main design components, a questionnaire and a web map, that are connected to each other to gather spatial and non-spatial data. Users of such tools perform various map interactions (e.g., drawing points, polygons, or selecting map features) from an active map layer and subsequently providing location-specific responses to questions triggered by the map interactions.
Geo-questionnaires are useful to planning practice and research as a data collection method. They can be used to reach a wider audience (compared to methods such as focus groups). Also, they are considered as suitable for land use planning processes (e.g., heritage planning, tourism) as they are framed in a specific geographic context (e.g., a city) referenced by a map. For my master’s thesis, the City of Stratford, ON was referenced in IP.
Due to its utility, several researchers and planning practitioners implement geo-questionnaires to solicit public input to inform land use planning processes. However, it is important to understand the suitability and utility of this method to various planning contexts. This informed the basis of my thesis. By focusing on urban infill developments (i.e., increasing the economic, population, and housing densities of an already built-up area), my thesis sought to understand how these tools can be used by citizens to designate future land uses for potential infill development sites.
Design and development of Infill Planner.
IP was designed, developed, and tested in a simulated urban infill planning process for selected sites in the City of Stratford, ON. The two simple 2D and 3D maps used in IP were designed to display two spatial datasets: the building footprints for the city and selected under-used land parcels suitable for development. The questionnaires were designed to capture the following information from users of the tool: background information, place attachment qualities, future land use preferences, factors influencing land use preferences, and feedback on tool design.
Infill Planner was developed using ArcGIS Pro and various functionalities afforded by ArcGIS Online (Map/Scene Viewer, Survey123, and Experience Builder). The following sections outline each of the main steps involved in the development of IP.
1. Processing of spatial datasets (building footprints and under-used land parcels)
This process was done using ArcGIS pro.
Creation of a spatial database of building footprints of the City of Stratford, ON.
Using satellite imagery, the roof forms of buildings in the city were digitized to create 2D polygons. These 2D polygons were then extruded to create simple 3D multipatch features for each of the building footprint polygons. This was to help provide more context of the city layout in terms of building densities. These two building footprints (2D and 3D) were published to the University of Waterloo ArcGIS Online account.
Selection of under-utilized land parcels
Two features layers, the land parcels feature class for the city and the 2D building footprint polygons, were used to identify parcels without buildings, and to further eliminate parcels that were not suitable for land use developments (e.g., too small, irregular shapes). A total of 8 land parcels, out of the remaining land parcels, were selected and configured to show parcel information (e.g., address, photos and property and neighborhood information), and published to the University of Waterloo ArcGIS Online account.
The next steps of the design and creation of the web tool were undertaken in the University of Waterloo’s ArcGIS Online environment.
2. Creation of map views.
The final selected land parcels and building footprint feature layers (both 2D and 3D) were used to create two map views, one 2D and one 3D. These map views were respectively created using the ‘Map viewer’ and ‘Scene viewer’ tools in ArcGIS Online.
3. Creation of surveys
Three surveys were created using the Survey123 application available in ArcGIS Online. The surveys were designed for three different purposes each. First, for the gathering of demographic characteristics of recruited participants, next for collecting land parcel-specific comments (e.g., development preferences) and lastly, feedback from the use of the tool.
4. Integrating main design components using Experience Builder
The two main design components of Infill Planner, i.e., the map and questionnaire, were integrated into a single application using Experience Builder. Experience Builder is an application that facilitates the creation of single-page or multi-page web tools with little to no coding/programming, which can be intuitively designed and deployed for different screen sizes. It provides a variety of widgets that can be used to enhance the capabilities of web apps (e.g., bookmarks, section views, buttons, etc.).
IP was designed as a four-page web app. The Introduction page provides a background overview of the project. The About You and Feedback pages display surveys to gather background information about the research participants and their experience regarding the use of the web app respectively.
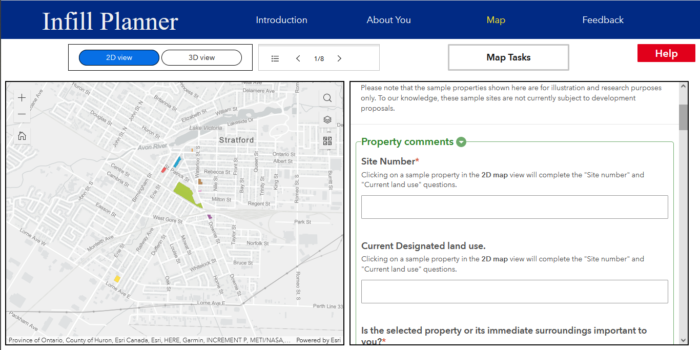
The Map page (image above) was the central focus of IP. The 2D and 3D map views (left) were displayed and interactively linked to the questionnaire (right). On this page, participants had to: 1) select one of the parcels (colored polygons) in the map views, 2) review background information about the parcel (including viewing pictures taken), and 3) fill and submit the survey. Additional buttons, i.e., Help and Tasks buttons, were provided to help people use the tool.
In the past 20 months, where it was impossible to undertake research using physical and in-person approaches, a web tool like IP provides a convenient way to gather data. I must say that I enjoyed and learned a lot in the use of Experience Builder to develop web apps.
Click here to view Infill Planner. NB: View using a desktop/laptop (any large screen aside phones) as the tool has not been configured for small screen sizes.