
Homicide Analysis in Metro Vancouver
Canada measures crime using the crime severity index: an index that measures the volume and severity of police-reported crime. Crime has dropped significantly over the last decade. However, in the past two years it has increased again. A homicide is defined, by Stats Canada as first and second degree murder, manslaughter, and infanticide [1].
Most people don’t know that, historically, crime rates were highest in the Western Provinces. The city of Vancouver is known for gang violence and poverty crises.
This project investigated two questions; (1) whether homicide rates in Metro Vancouver were directly related to population density, and (2) whether homicide occurrences were clustered, dispersed, or randomly distributed throughout Metro Vancouver.
Study Area
The Metro Vancouver area is located on the southwestern Coast of Canada. There are 21 municipalities [3], with a population density of 854.6/km2 [4] (Figure 1). Metro Vancouver has the fifth highest crime rate of the 15 major Canadian Cities [2]. Since Vancouver is such a big city, there is a lot of media coverage on crimes, but in reality, the city has a much lower crime rate than people think.

Data
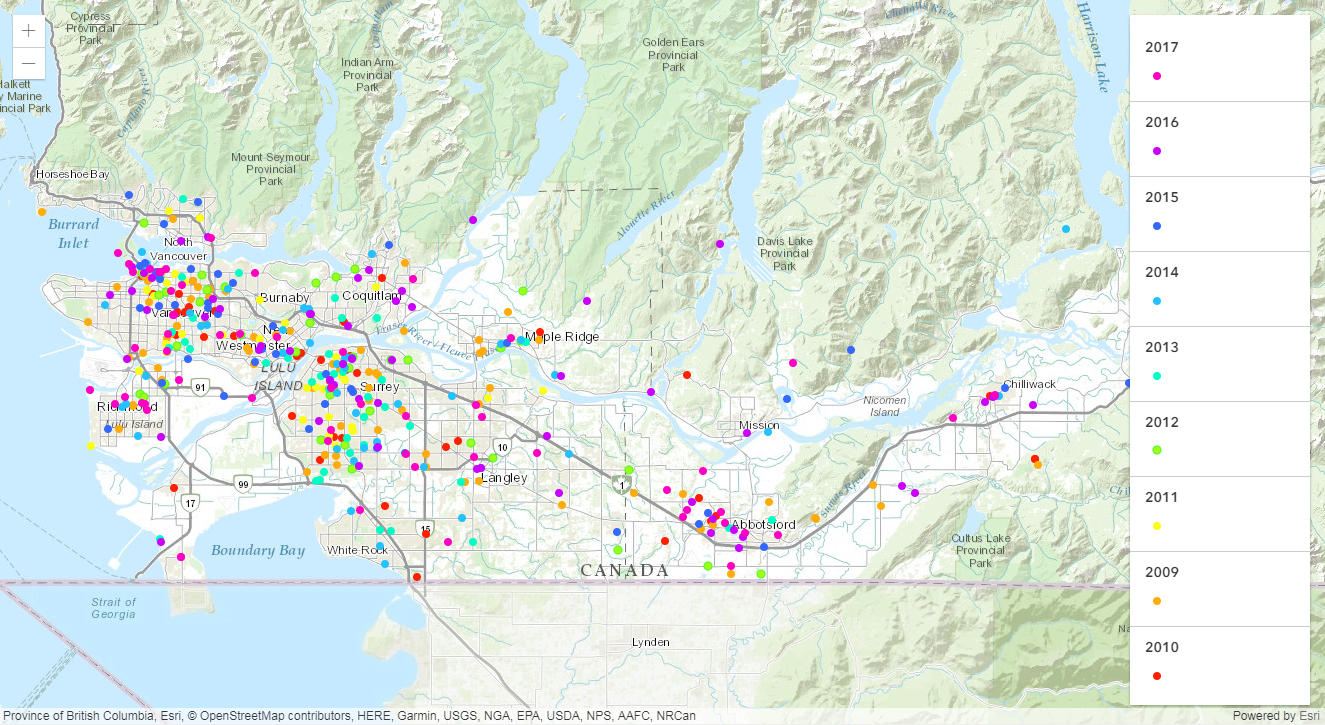
The data are a map of homicides in Metro Vancouver from 2009-2017 (Figure 2). The map has data on who was murdered, the date of the murder, the place of the murder and also has a brief text about the victim’s relations and the fatality. For example, “Gurmit Singh Dhak – Oct. 16, 2010, The long-time gangster and convicted killer was gunned down inside his luxury SUV outside Burnaby’s Metrotown mall. His wife and children were watching.” The colour of the symbol represents the year the murder was committed.
The “Murder Map,” was published by the newspaper the Vancouver Sun [5]. It includes no author or reference to original data.
Analysis
Are Homicides Randomly Located?
To investigate whether homicides were randomly located throughout Metro Vancouver two analyses were used; (1) nearest neighbour analysis and (2) quadrat analysis. Nearest neighbour analysis examines the distance between points in a data set. This statistic determines if data are clustered, dispersed or random. The average distance between murders in Metro Vancouver was 1001.323 meters. If the data had followed a random distribution than the predicted nearest neighbour distance would have been 1574 meters.
Quadrat analysis tests whether not a spatial pattern is significantly different than a random spatial pattern. The variance of homicide point spatial pattern was 59.529. The variance is greatly influenced by the density of the points and as such is commonly standardized by using a ratio of the variance to the mean number of points per cell (Figure 3). The mean number of points per cell ( 4.19) then produced a variance-mean ratio of 14.207. In a perfect random distribution the variance and the mean are equal. The mean was found to be lower than the variance therefore the data were not randomly distributed. Using the variance-mean ratio, a chi-square test was performed to ascertain if the data were significantly different than a random distribution. The p-value was found to be zero so we reject the null hypothesis: there is no significant difference between the observed distribution of points and the distribution of a random spatial pattern, and we accept the alternative: there is a significant difference between the observed distribution and the random distribution of points.

Where Are the Highest Incidences of Homicides?
To ascertain the location of the highest incidents of homicides, two local statistics were used: (1) the Kernel Density Estimation (KDE), and (2) the K-Function. The KDE created a surface that showed “hot and cold” areas. In this case the hot areas represent greater homicide occurence and cold areas represent the opposite. To calculate the KDE, a window or bandwidth was optimized such that each kernel had an average that produced a surface that was not choppy or over generalized (Figure 4). The bandwidth was applied to the data and the surface was created (Figure 5). This surface shows that the majority of the crimes occurred around Greater Vancouver, Surrey, Richmond, and Burnaby. These four areas also contain the majority of the population of Metro Vancouver. The study area had first order spatial variation meaning the locations of the points were related to the population. The darkest blue areas, the areas with no crime occurrence were also either out of the study area or in the ocean.


The K-Function is a visualization tool to understand if a pattern is random, clustered or dispersed, at varying distances. This last part is key: the other statistics used do not test the variation in distribution at different distances, but rather are either local or global. The formula plots varying windows of averaging or r, against their k-value. The data are clustered significantly higher than the line and the confidence interval for a data set to be a random distribution. (Figure 6).

Limitations
As the original source is unknown, it is difficult to determine the accuracy of the data. The Vancouver Sun is a reputable source, but there was no way to verify their data. Another limitation was the inclusion of data points that occur outside the Metro Vancouver study area that were not corrected for. These data may influence the results.
The Takeaway
Through statistical analysis of Metro Vancouver it was found that homicides were clustered. These clusters occur in the most densely populated areas of Greater Vancouver: Surrey, Richmond, and Burnaby. The data also indicated that even within the municipalities, crime was clustered.
Crime data readily lends itself to spatial statistics. This leads to the ability to,predict where crime may be most likely to occur. These statistics can easily be mapped against many different variables, such as socioeconomic data, to investigate relationships. Politicians, police departments, and city planners have the potential to use this data in order to direct community based decision making and resource allocation.
References
[1] Police-reported crime statistics in Canada, Kathryn Keighley, Statistics Canada. 2017
[2] Safe and Unsafe Cities, Mainstreet Postmedia. 2017. http://www.news1130.com/wp-content/blogs.dir/sites/9/2017/08/23/357006807-Mainstreet-Safe-and-Unsafe-Cities-2017.pdf
[3] Vancouver, M. (n.d.). About Us. Retrieved October 03, 2017, from http://www.metrovancouver.org/about/Pages/default.aspx
[4] Population and Dwelling Count Highlight Tables. Statistics Canada. 2016.
[5] Vancouver Sun, 2017. The Vancouver Sun Murder Map 2009-2017. Retrieved online from: http://www.vancouversun.com/news/murder-map.html.