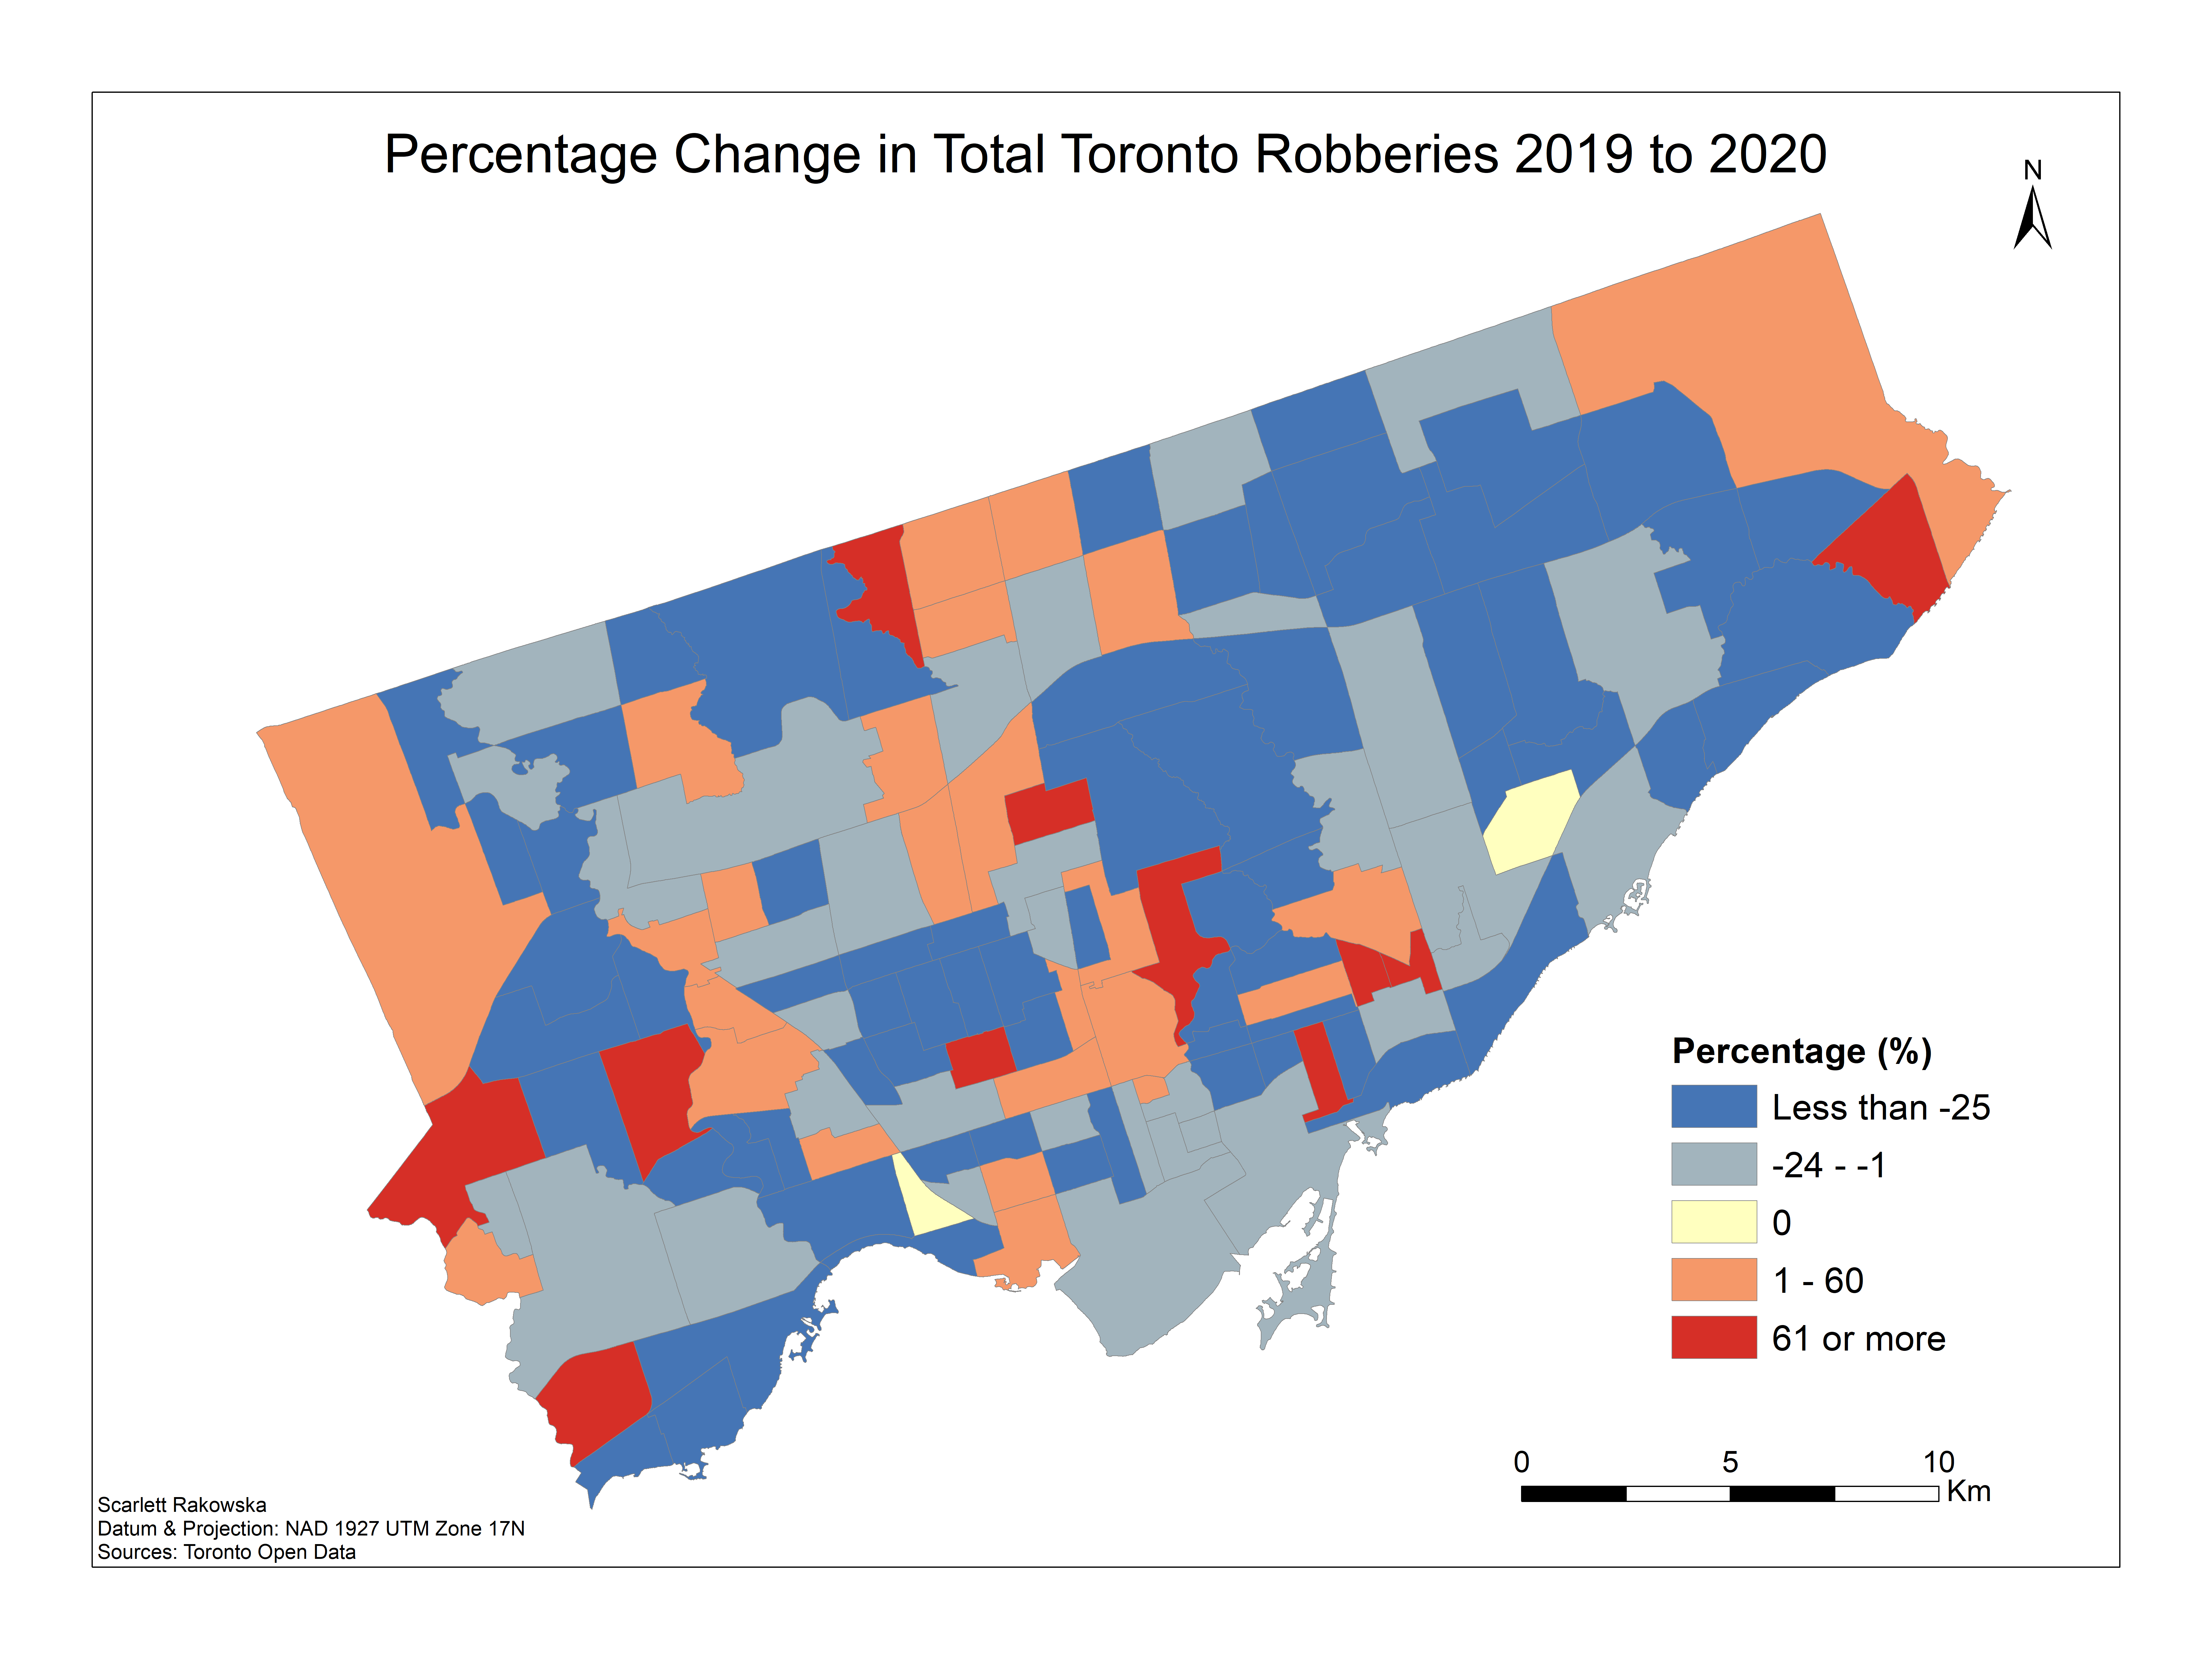
 Analyzing the Change in Toronto Crime Data from COVID-19
Posted 2 years ago
By Scarlett Rakowska in the UofT Blog
About a year ago, I wrote a blog post analyzing Toronto Crime Data using Kernel Density from the 2019 data of major crime indicators. After the COVID-19 restrictions were put in place in March 2020 for the city of Toronto, I was curious to see the changes in crime in Toronto from 2019 to 2020. […]
Read More
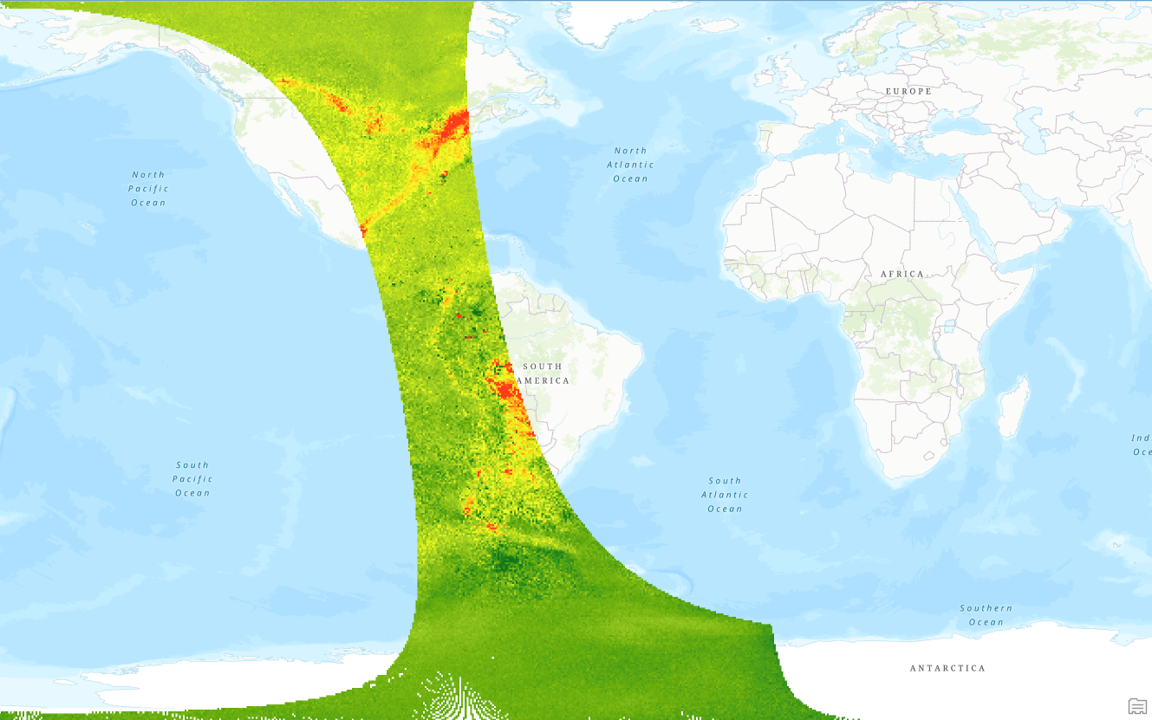
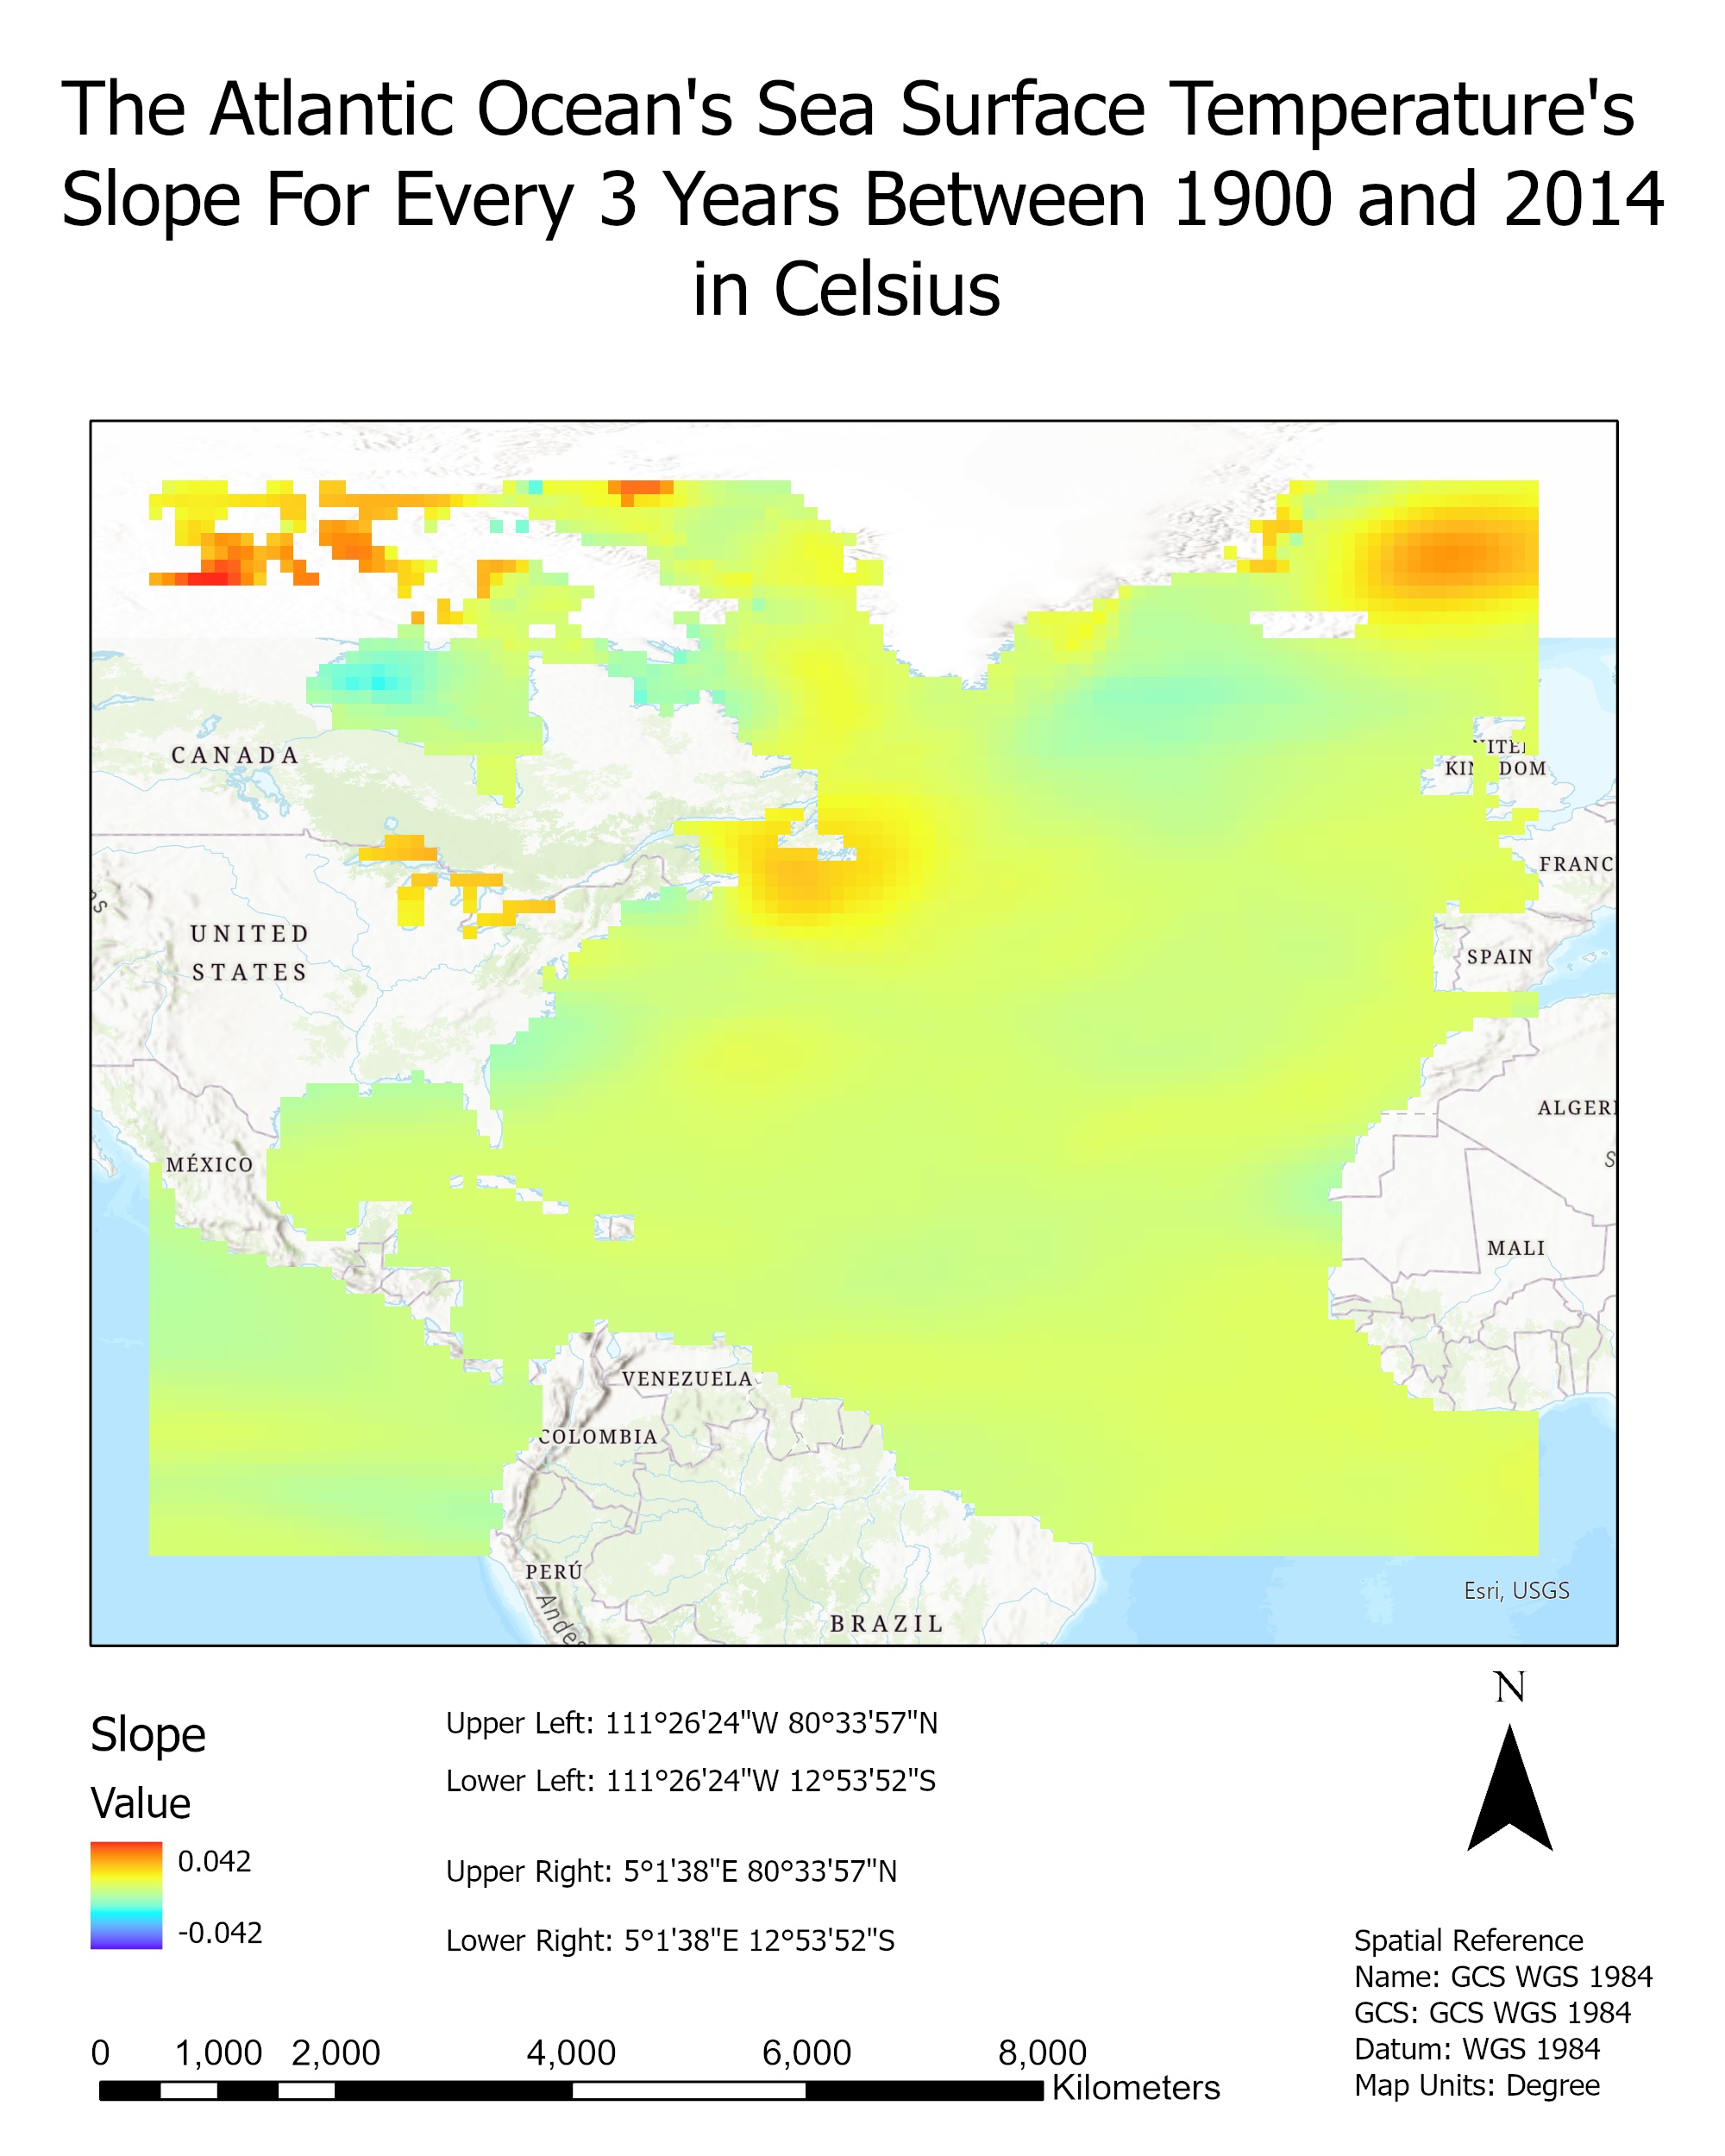 Analyzing the Changes in the Atlantic Ocean’s Sea Surface Temperature from 1900 to 2014 using ArcGIS
Posted 2 years ago
By Sana Hashim in the UofT Blog
This blog post showcases part of my analysis for a school assignment. I was given a CSV file that modeled the sea surface temperature of the Atlantic Ocean for every three years from 1900 to 2014 in degrees Celsius. The data were collected from the COBE SST dataset from the Japanese Meteorological Agency. Using the data file, I […]
Read More
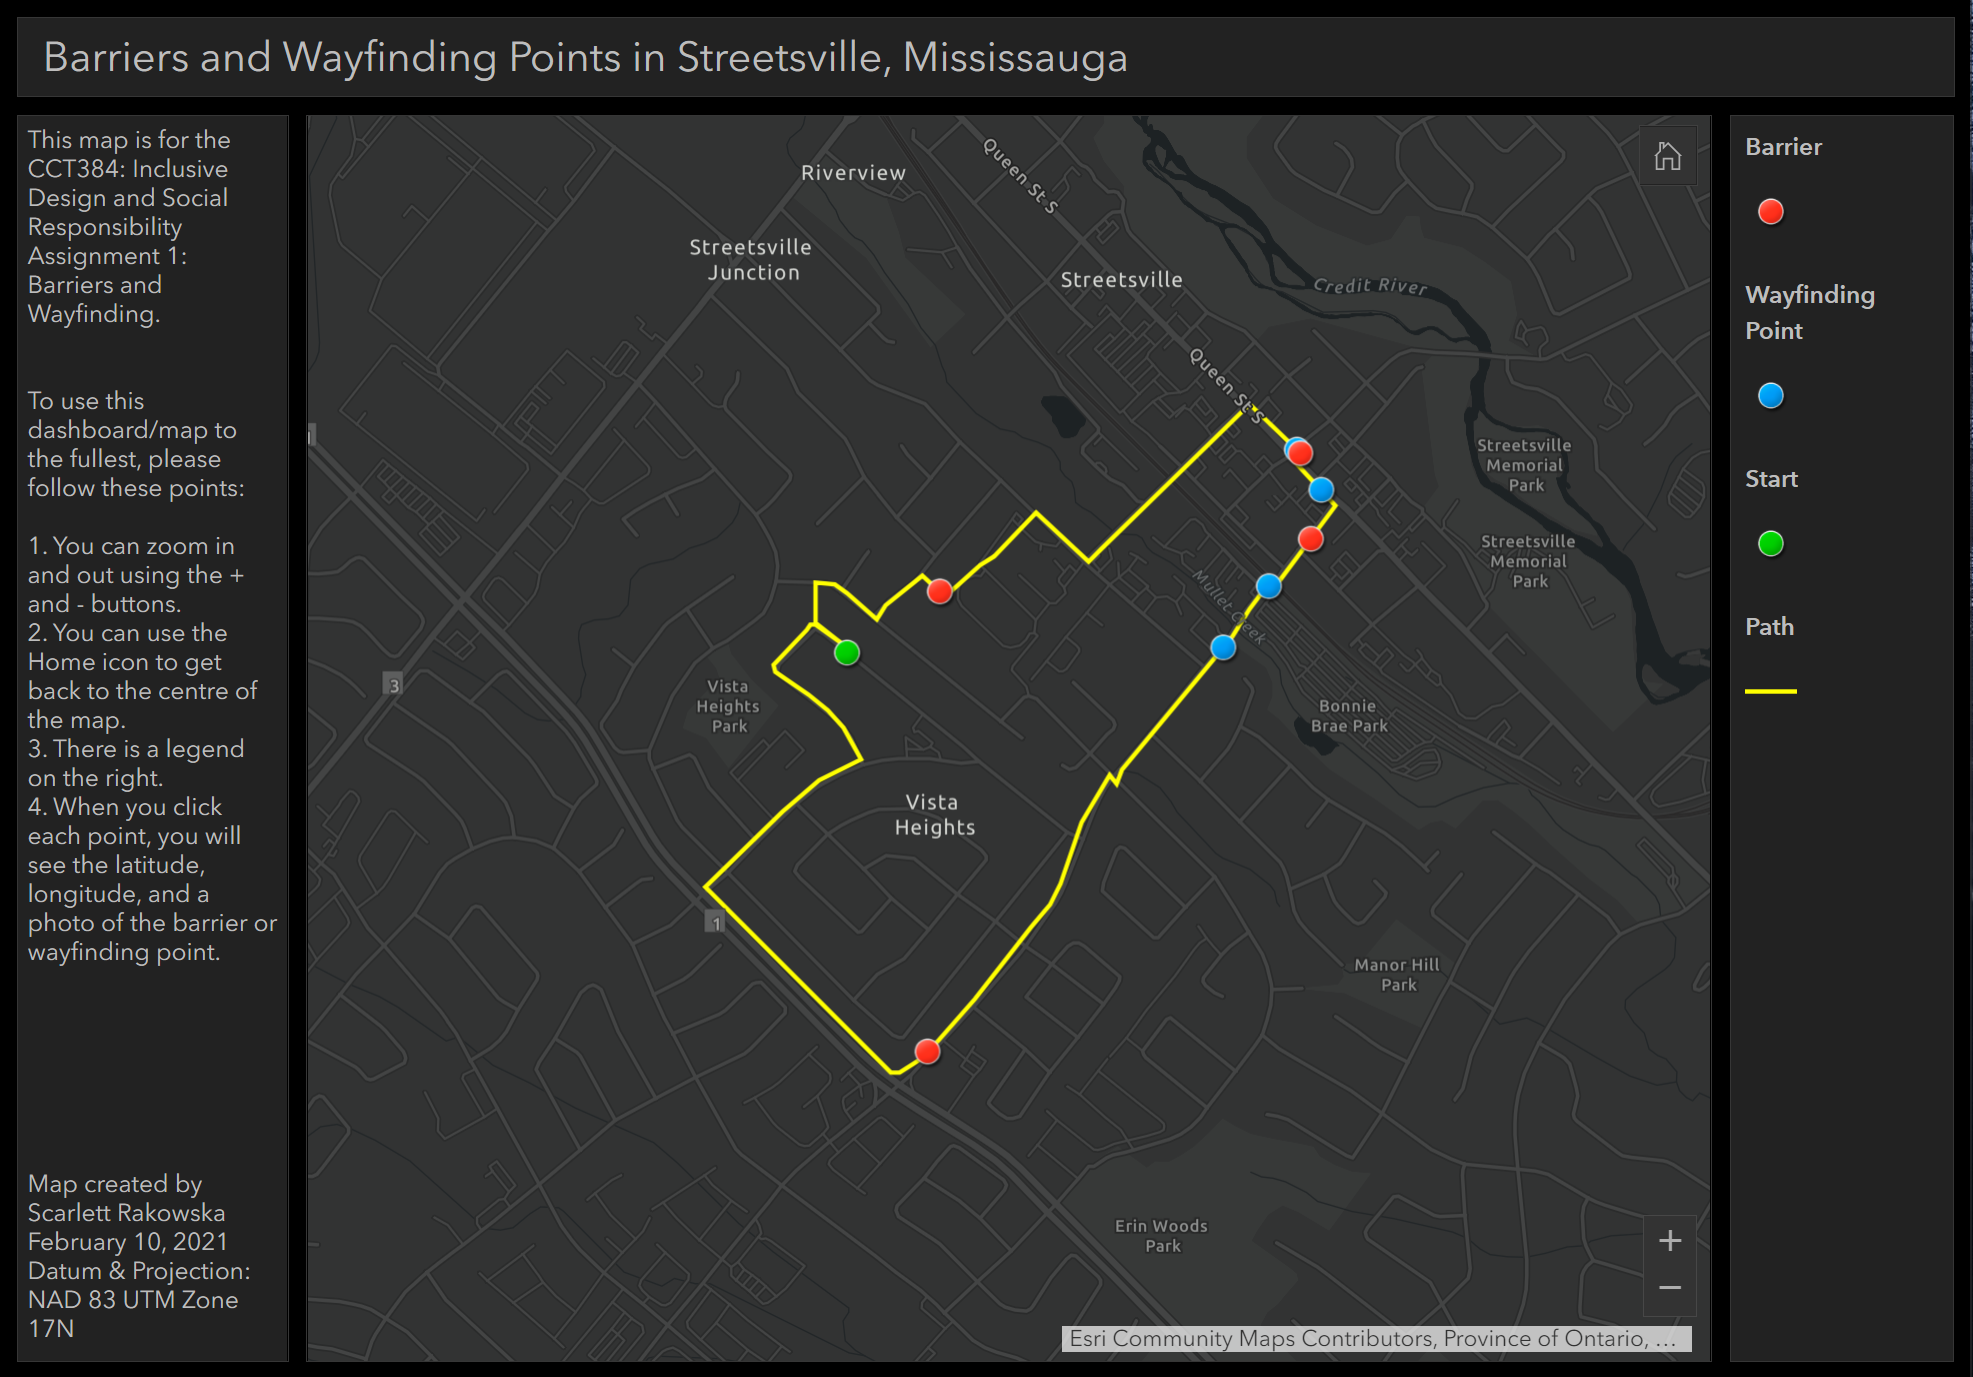 Utilizing GIS in other disciplines: Implementing photos in webmap pop-ups
Posted 3 years ago
By Scarlett Rakowska in the UofT Blog
As an undergraduate student at the University of Toronto Mississauga (UTM), I am double majoring in Geographical Information Systems (GIS) and Communication, Culture, Information, and Technology (CCIT). I am currently taking a CCIT course that involves inclusive design and social responsibility. For one of the assignments, we had to walk around our neighbourhood and take […]
Read More
 Exploring NDVI using ArcGIS Online
Posted 3 years ago
By Nicole Moguilevskaia in the UofT Blog
Hi everyone! My name is Nicole and I am a third year GIS major at the University of Toronto. As part of my degree, I get to take many fascinating courses related to GIS. This past semester, I completed GGR337: Environmental Remote Sensing. The course highlighted things such as satellite sensors, digital image processing, and […]
Read More
 Using satellite data to model air pollution in ArcGIS
Posted 3 years ago
By Priya Patel in the UofT Blog
Modelling urban air quality is becoming increasingly important for understanding the impact that air pollution can have on public health. Air pollution can have a significant impact on human health, and long-term exposure to certain gases, such as NO2, can result in adverse health effects such as bronchitis, respiratory infections, or asthma attacks, among many […]
Read More
 Manually Geocoding – Preparing for Analysis of Green Space Accessibility in Ontario Elementary Schools and Student Performance
Posted 3 years ago
By Scarlett Rakowska in the UofT Blog
Learn how UTM student Scarlett Rakowska performed manual quality control to augment address geocoding output to get accuracy needed for subsequent analysis.
Read More
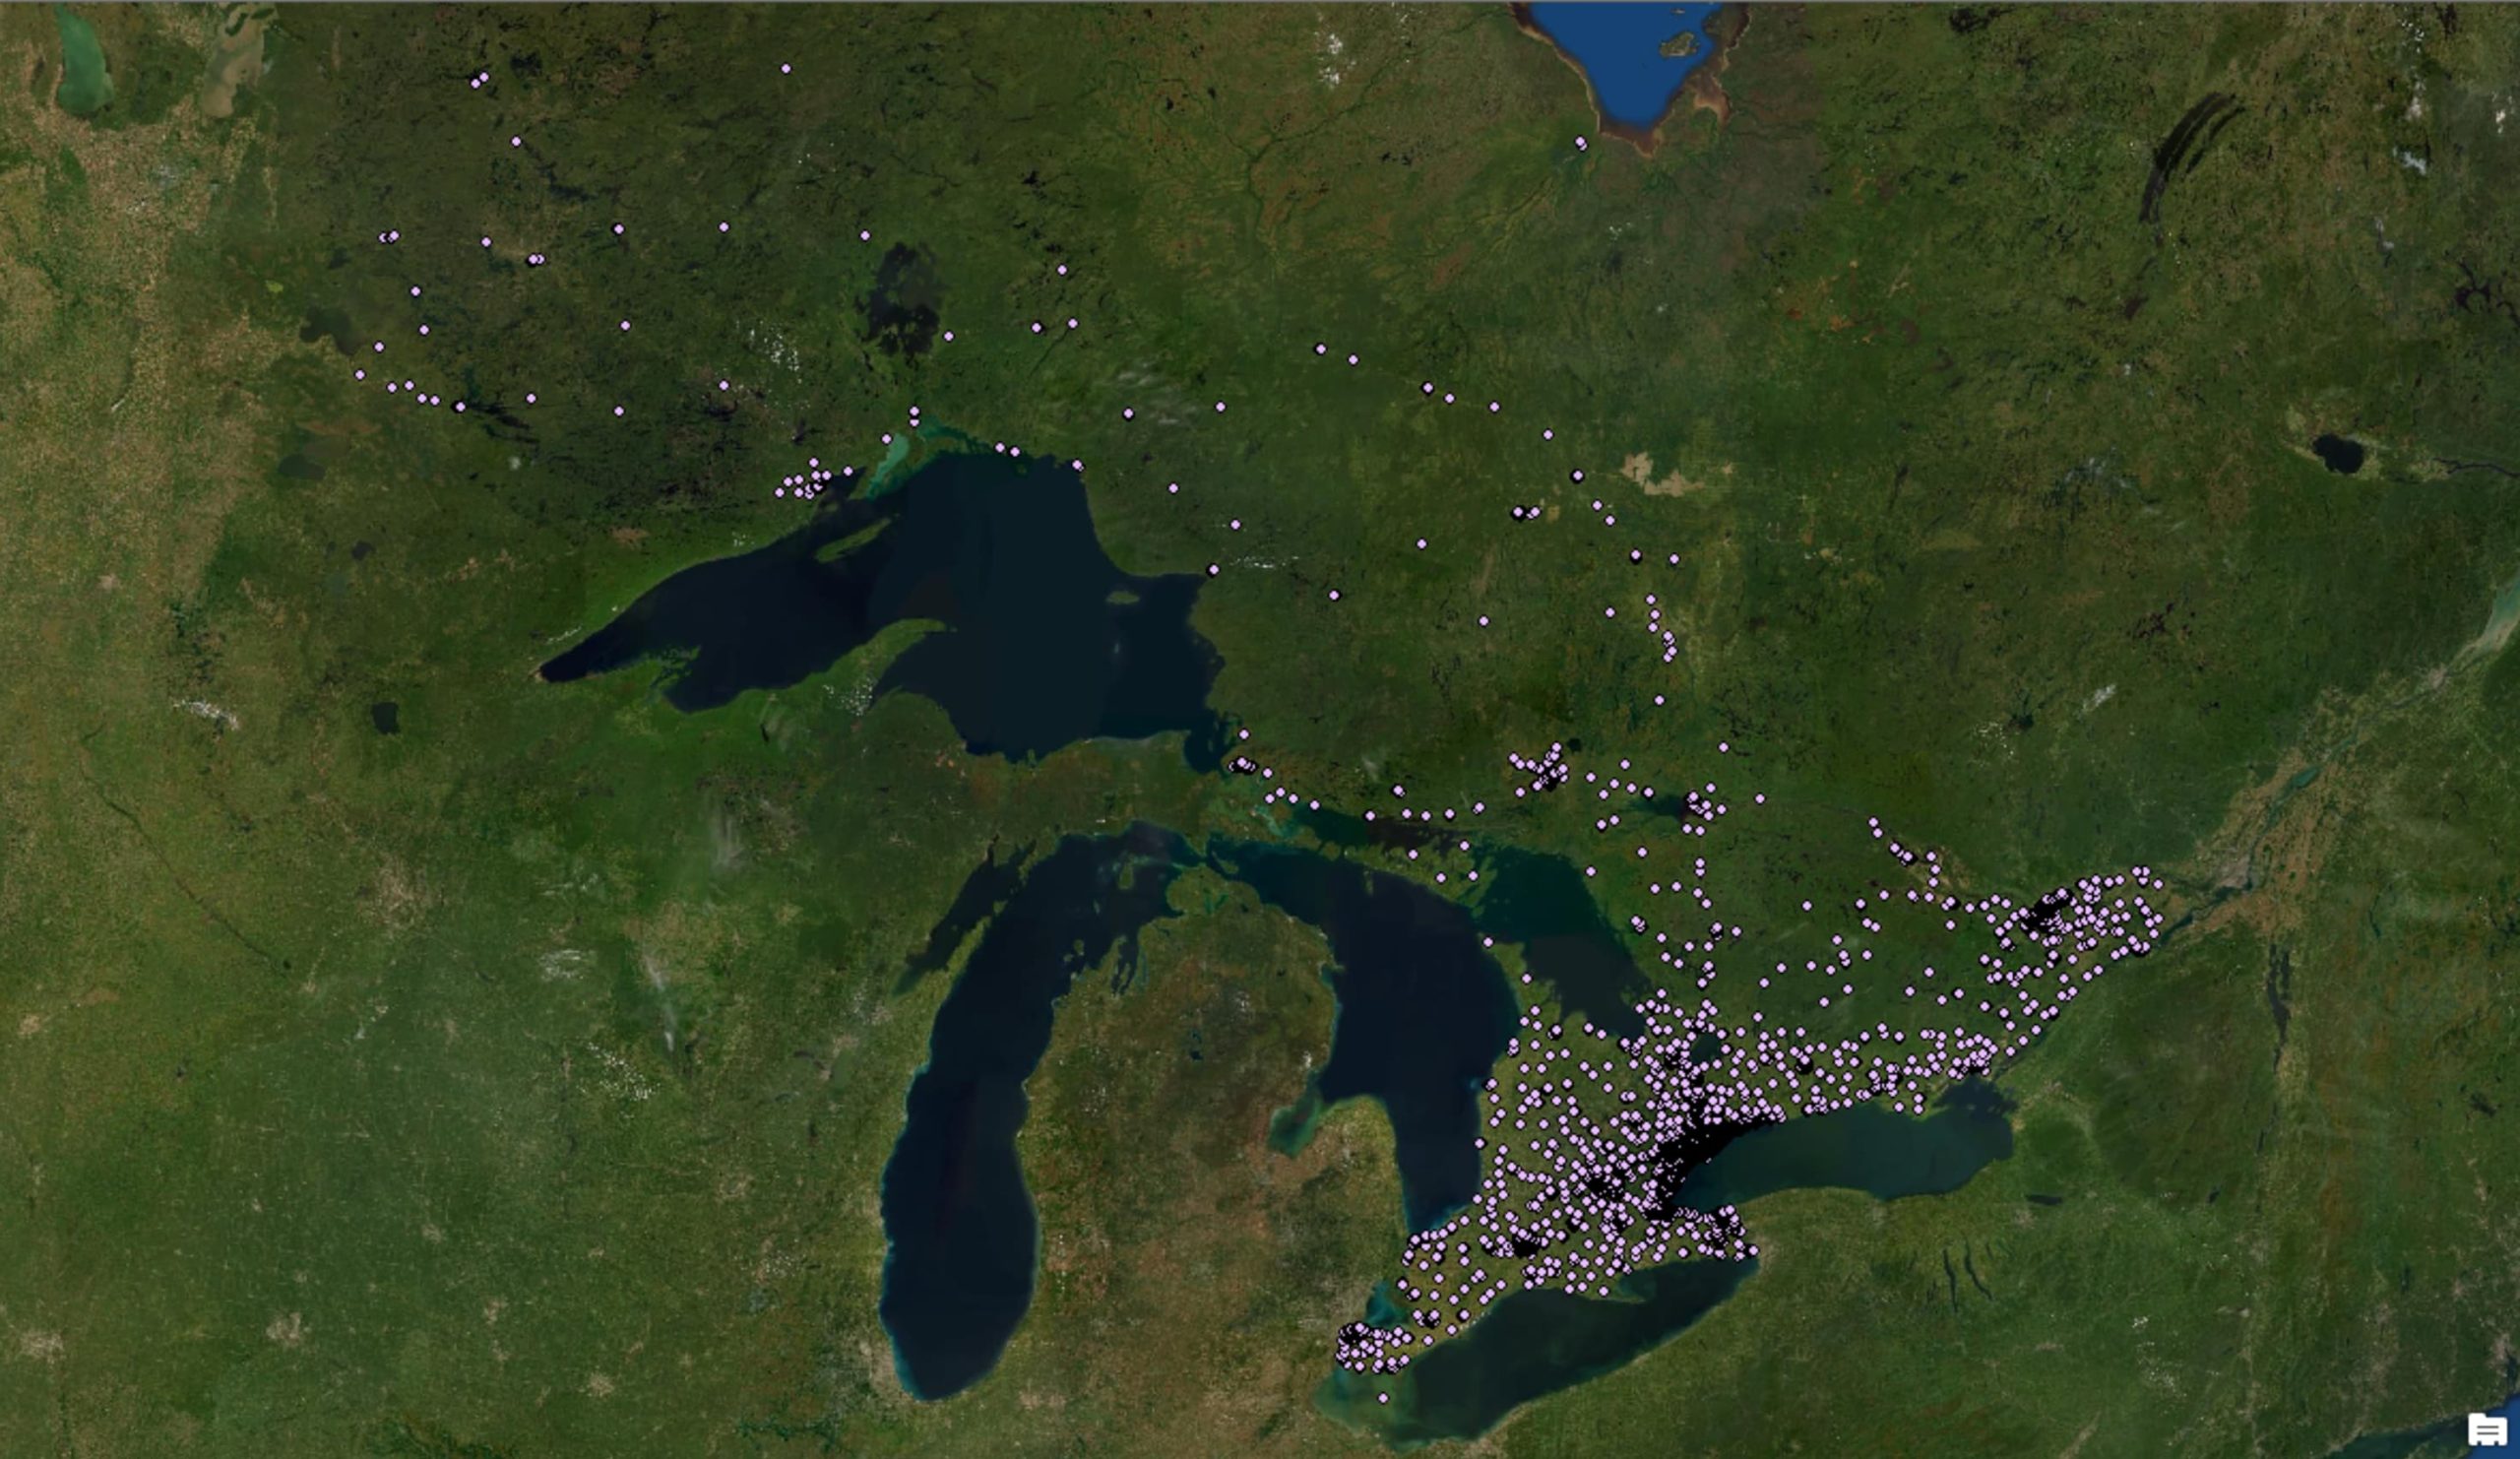
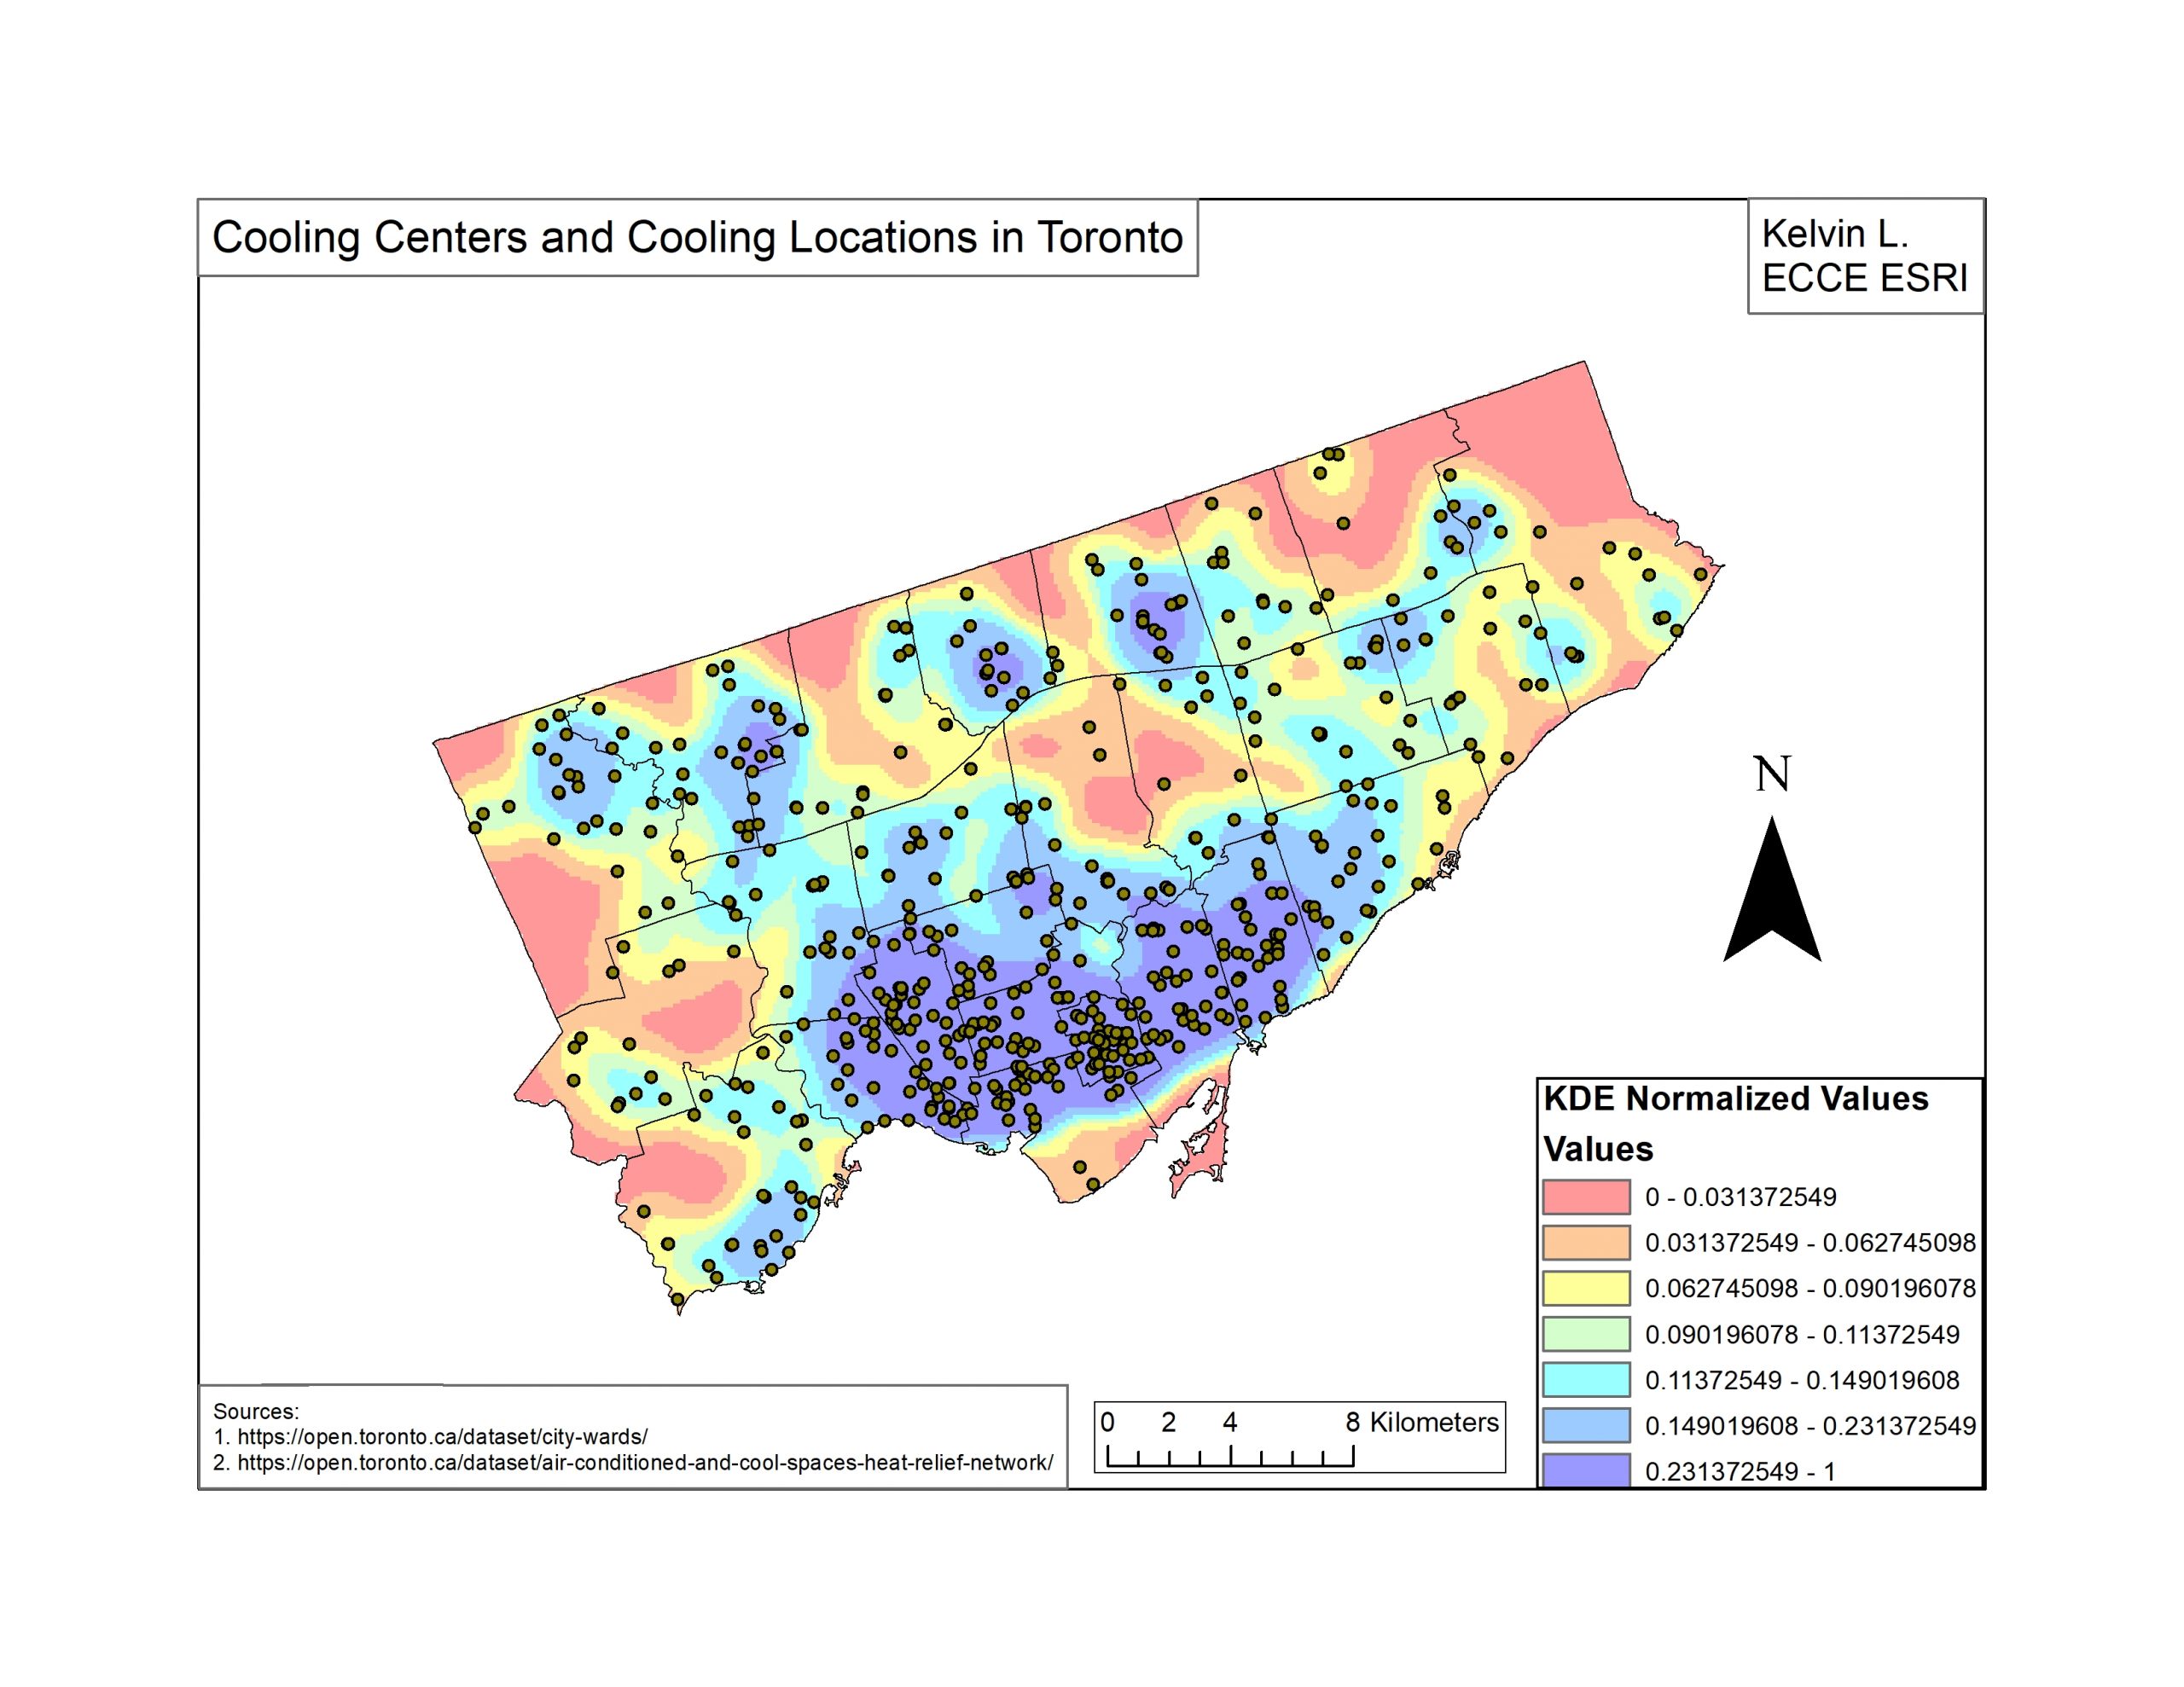 Cooling Locations for the Senior Population in Toronto
Posted 4 years ago
By Kelvin Lin in the UofT Blog
Over the past few years, the city of Toronto has introduced various cooling locations for people to refresh themselves during the summer. See how the spatial distribution of these locations matches with the distribution of some of the people who need it most.
Read More
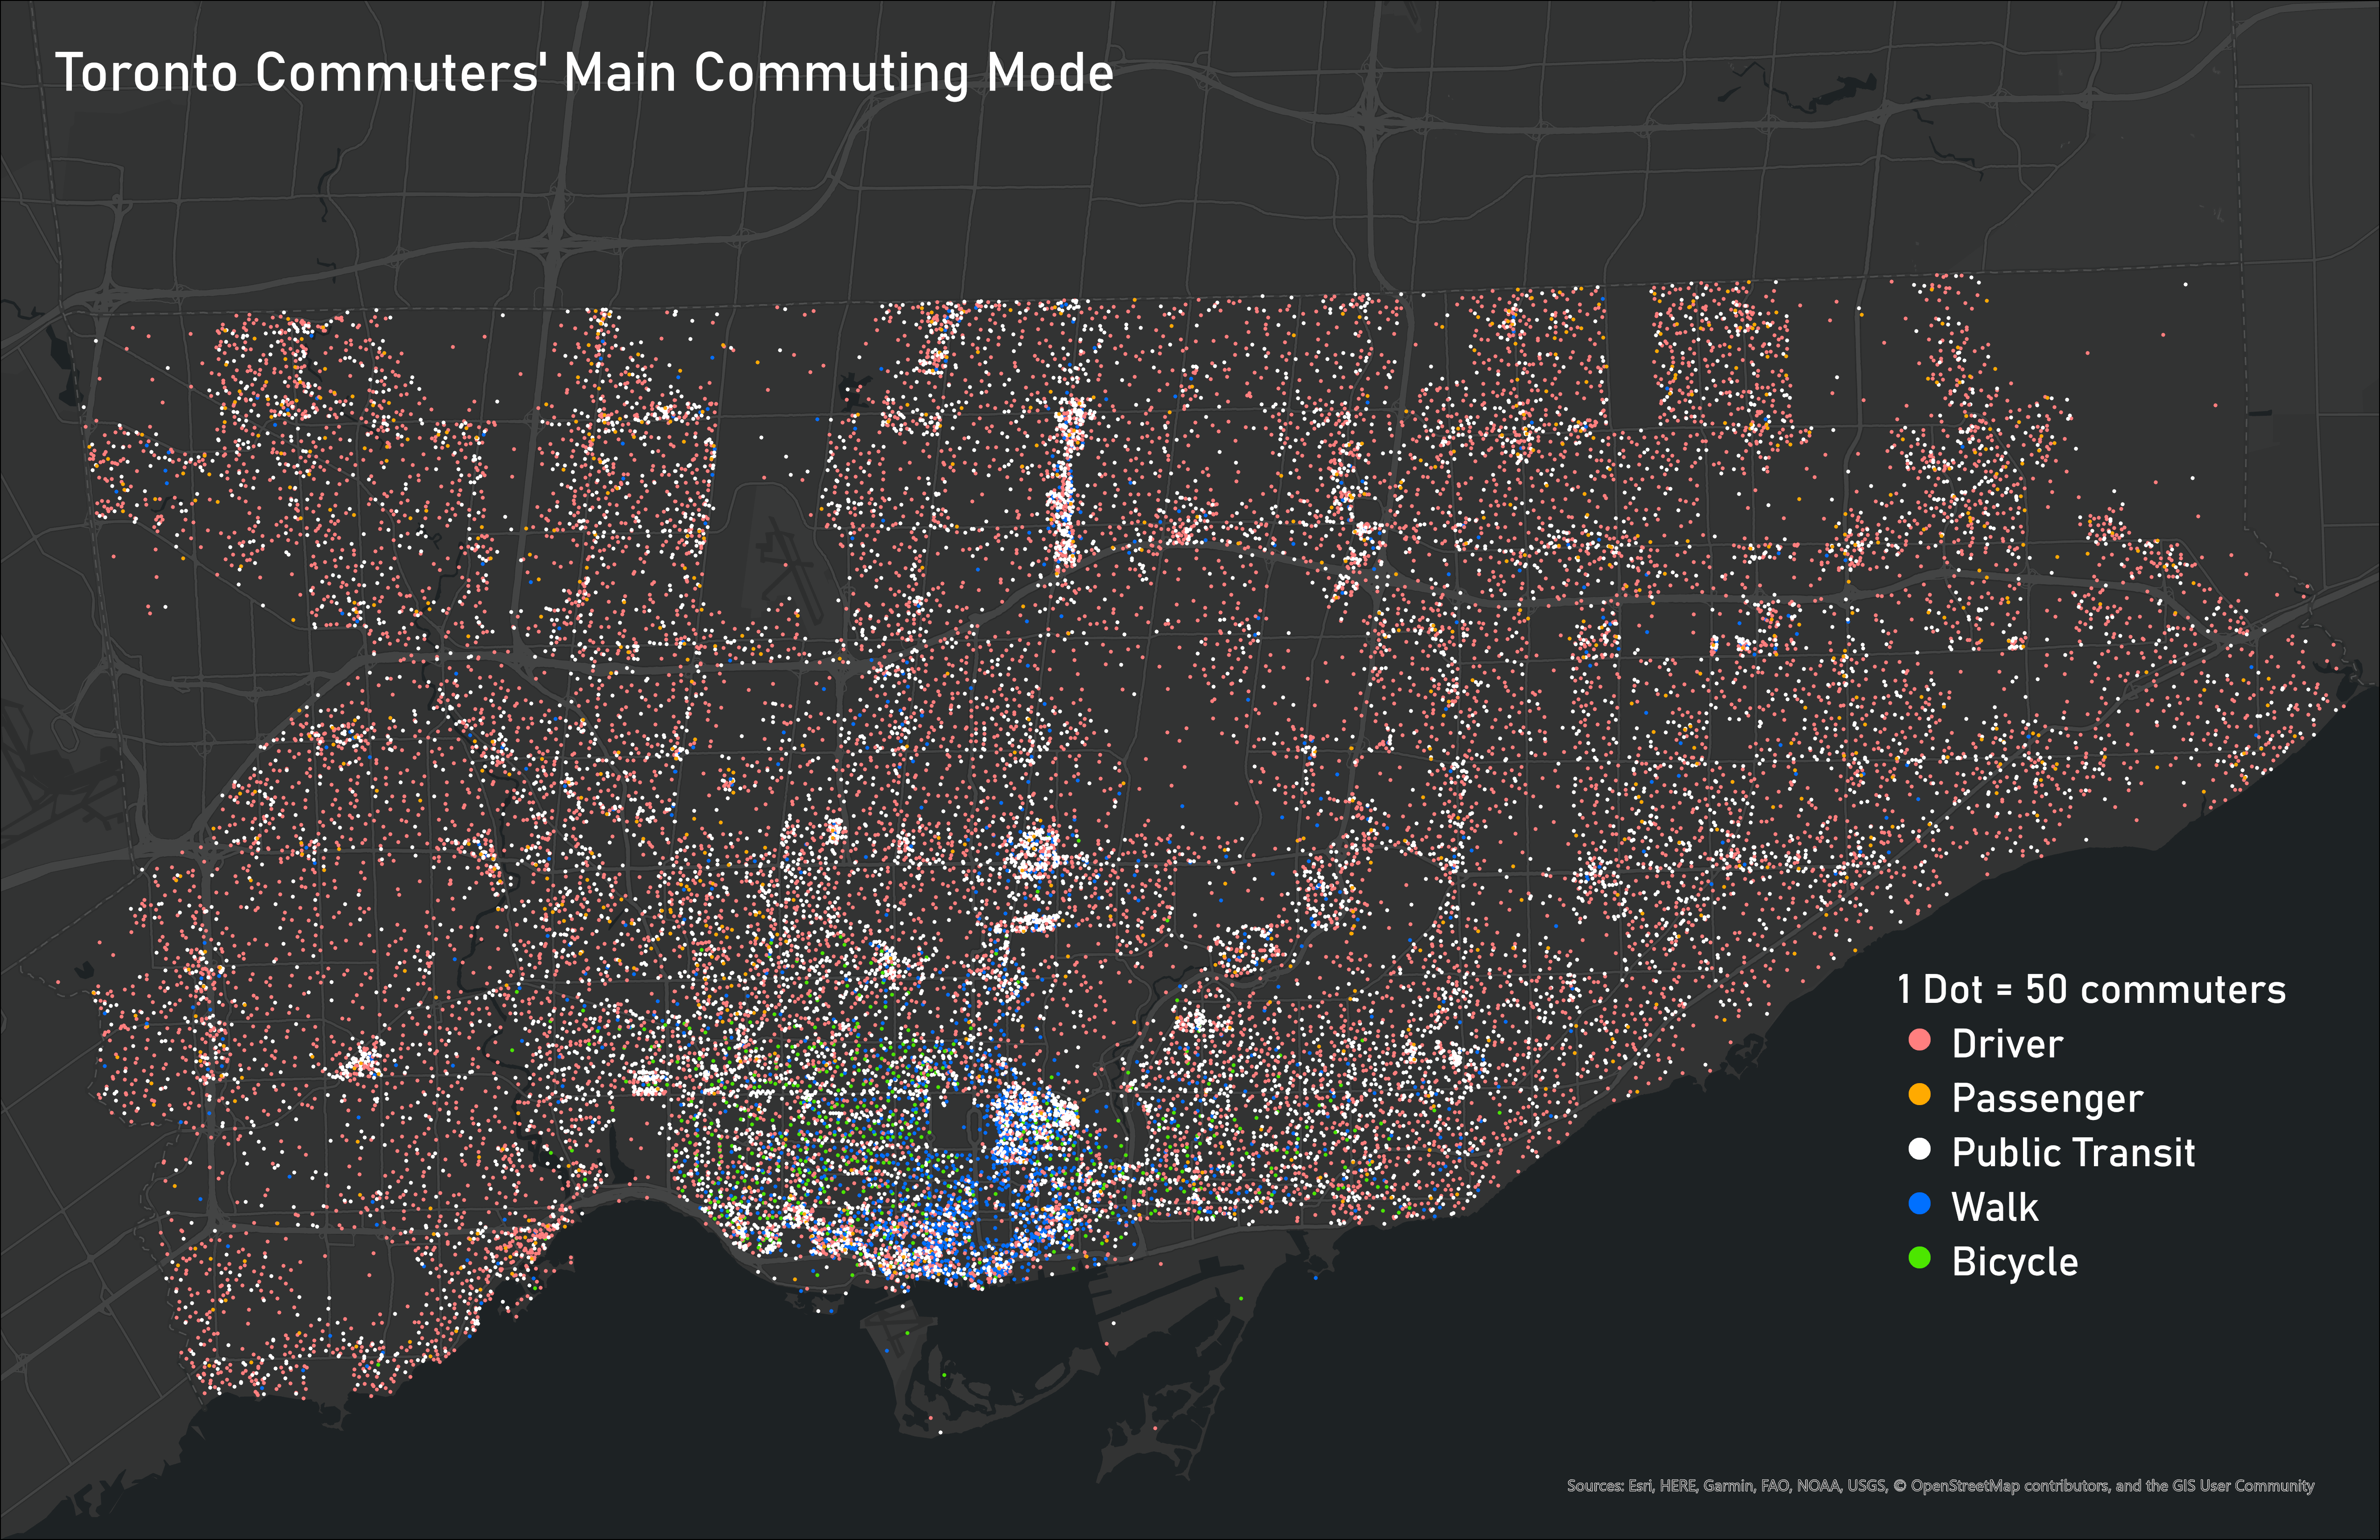 Ideas for Displaying Categorical and Time-Based Data
Posted 4 years ago
By Ben Klar in the Western Blog
Deciding the best way to visualize your data is one of the most important steps in making sure that message is clear and understood by the reader. But when you are working with many different variables, it can be challenging to display them all together on one map to show the connections between different categorical […]
Read More
 Creating Your Own GIS Guidebook!
Posted 4 years ago
By Ivy Liang in the UofT Blog
Last summer I worked as an Urban Planning Summer Student at my local municipality. My responsibilities included lots of development reviews and GIS work. I often found that I had to help my coworkers with basic GIS / ArcMap functions such as searching for an address or changing symbology. Instead of waiting to ask the […]
Read More
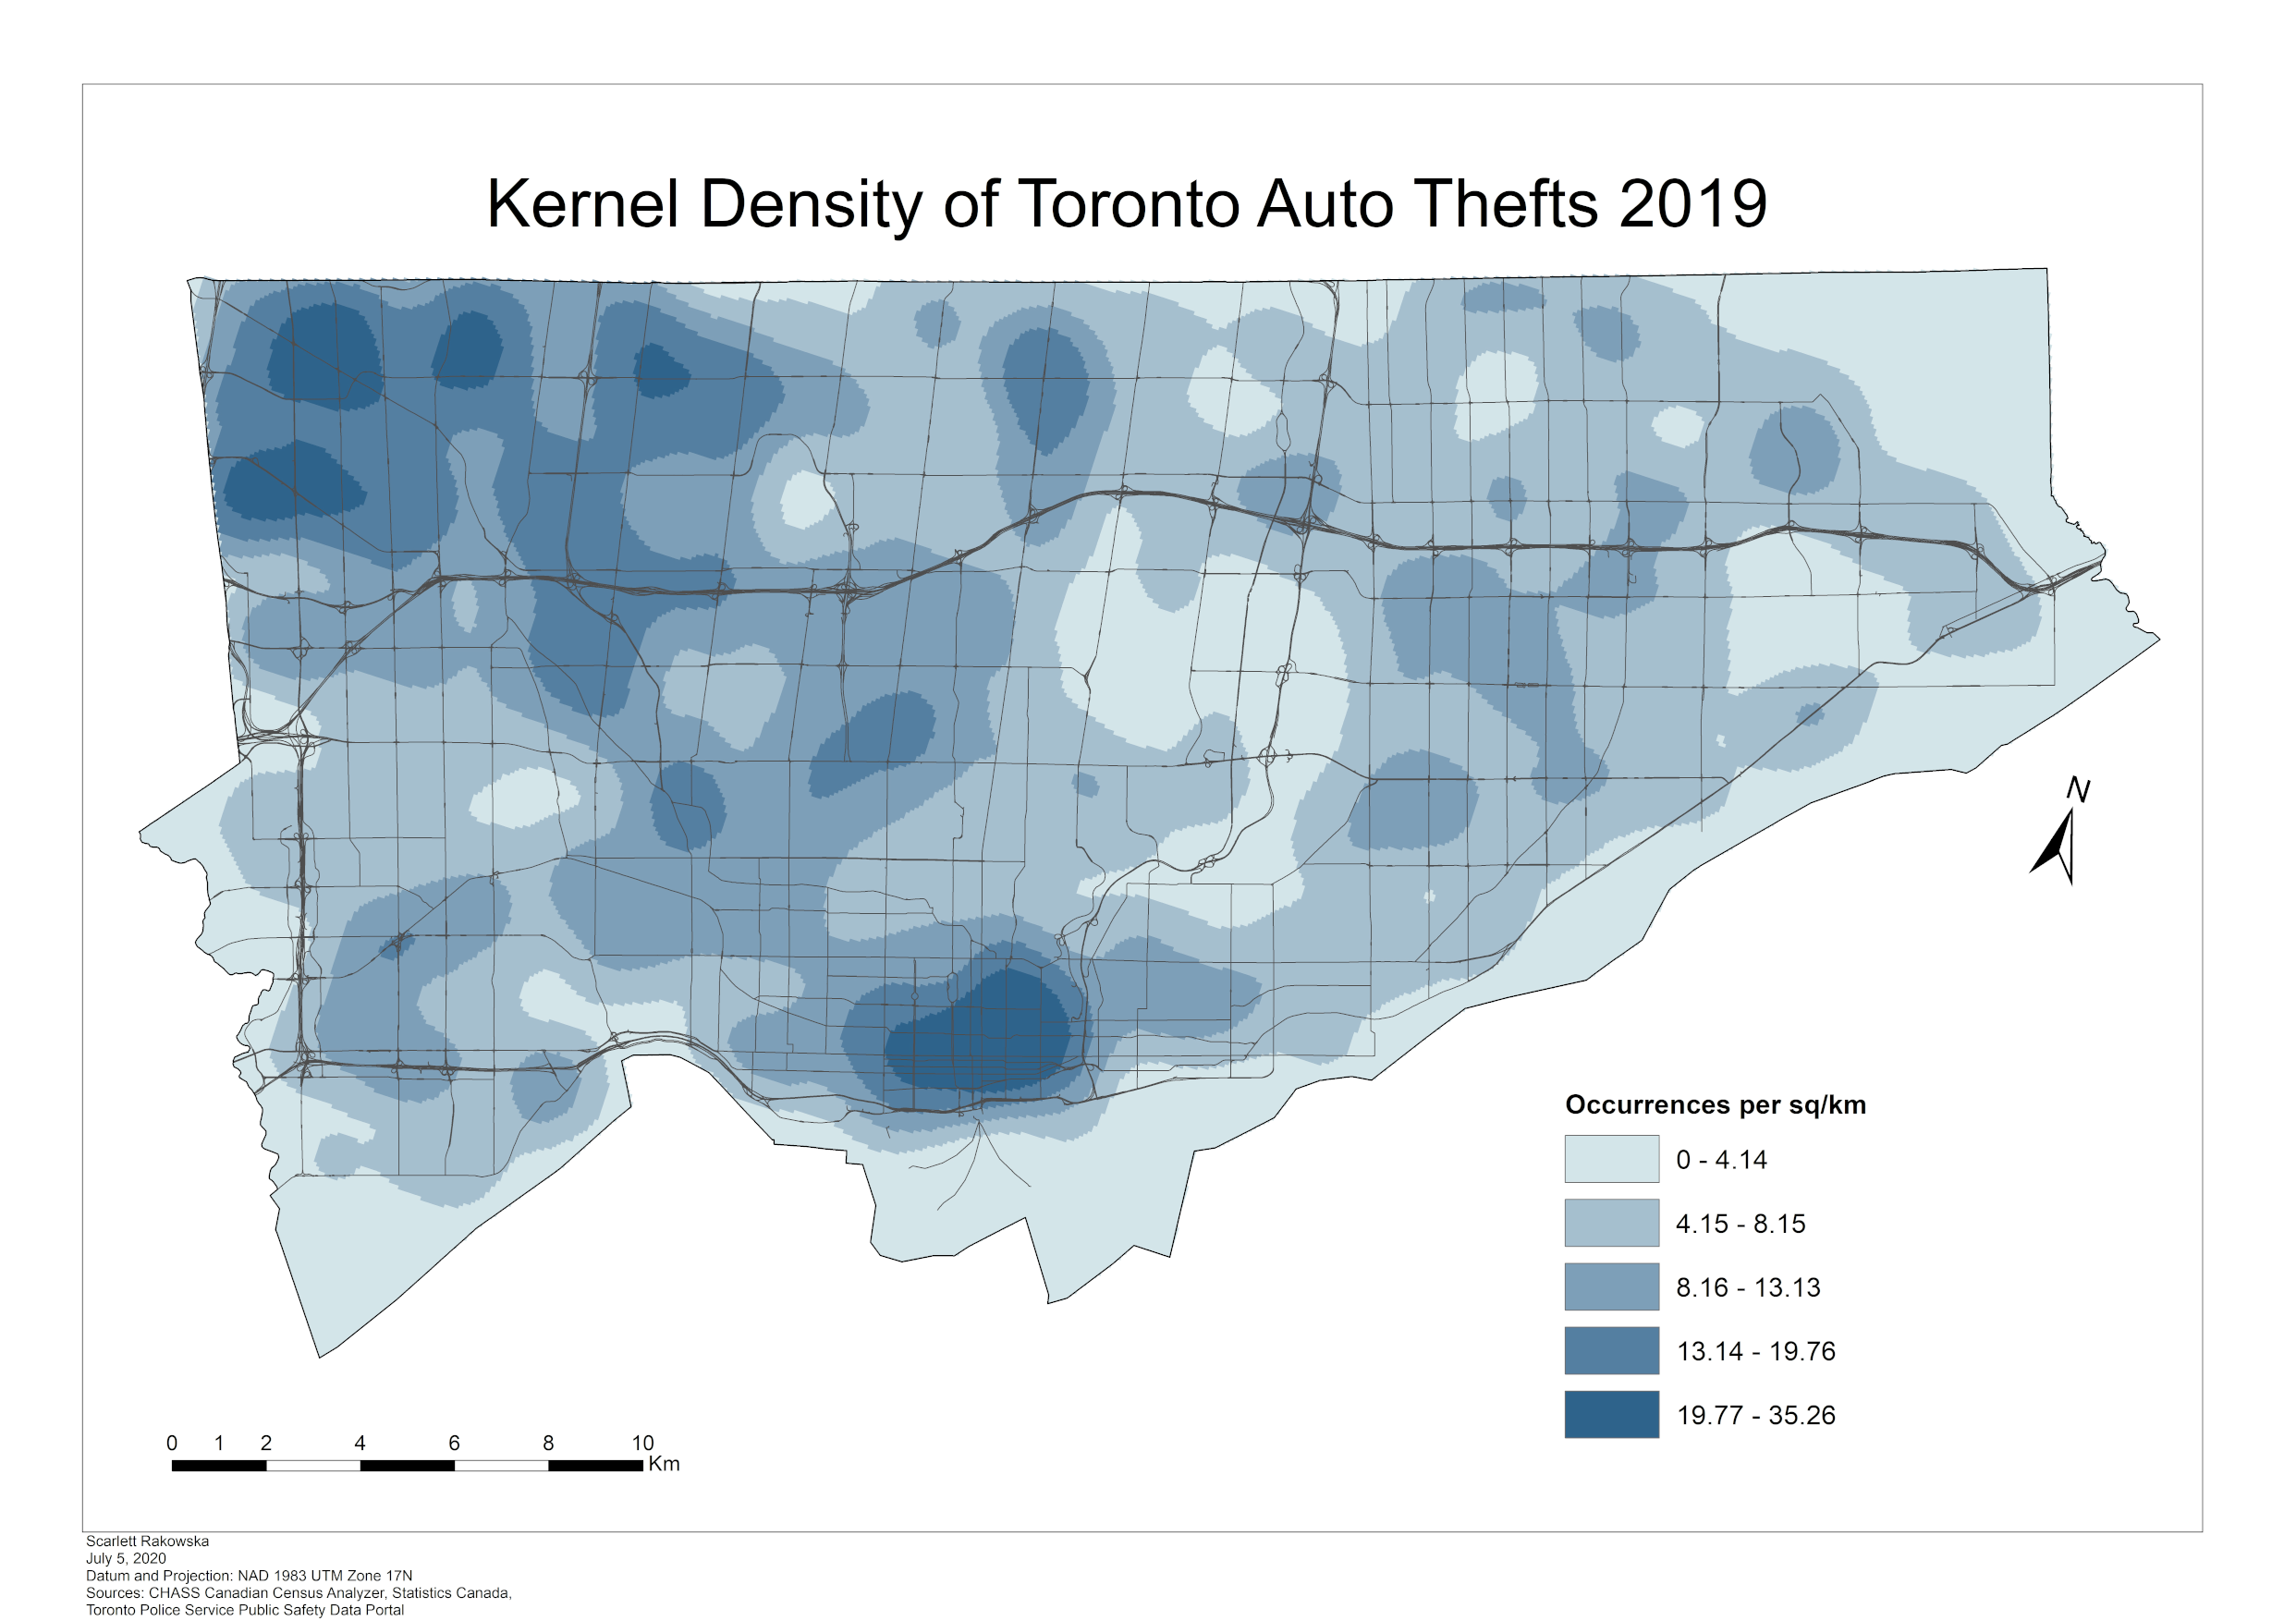 Analyzing Toronto Crime Data using Kernel Density
Posted 4 years ago
By Scarlett Rakowska in the UofT Blog
Recently, the Toronto Police Service released its 2019 data of major crime indicators. These indicators include assaults, auto thefts, break and enters, homicides, robberies, and thefts over. In this blog, I will analyze the major crime indicators for Toronto in 2019 using kernel density. Kernel Density Kernel Density is a spatial analyst tool that calculates […]
Read More