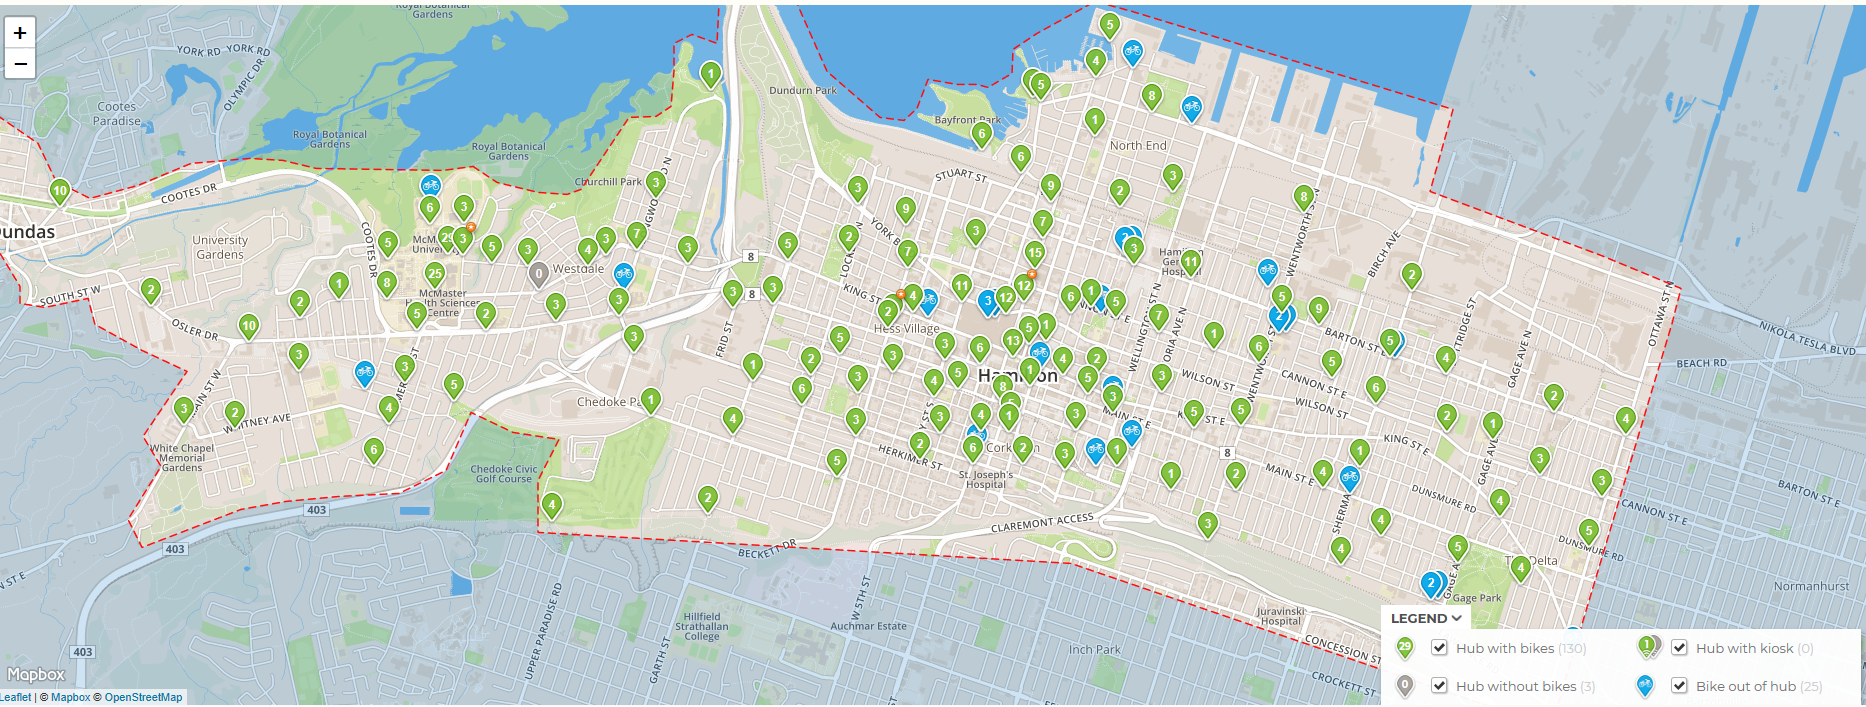
For this post I wanted to dive into some of the work I’ve been doing for my Master’s thesis in the Transportation Research Lab at McMaster. Our lab has a partnership with the folks at SoBi Hamilton, who manage the city’s bike share program. If you don’t know what a bike share program is, it is a service that allows customers to rent bicycles as a low-cost transportation method. Customer’s just pick up and drop off the bikes at hubs located across the city. Each bicycle is equipped with a GPS receiver, which tracks each bike’s location. GPS-equipped bikes are now the standard for bike share programs across the world as they help to prevent any bikes being lost from the fleet due to vandalism. A side-effect of GPS tracking is that it gives transportation researchers unprecedented amounts of data to explore how people are using bicycles to move around the city.
GPS is considered a gold standard in transportation research, as it passively collects route trajectories and spatial location (although positional readings may be off by a couple metres) without having to rely on travel diaries, which are time-intensive to conduct and rely on participant memory/willingness to participate. Through our partnership, our lab has access to virtually every GPS route made by a SoBi user since the program’s inception back in 2015. Of course, routes are fully anonymized so we can’t see who made the trip – that would be creepy! This gives us a wealth of information, as over one million trips have been conducted using these bikes. Therefore, this data can be used as a basis to examine active transportation problems within the SoBi service area of Hamilton.
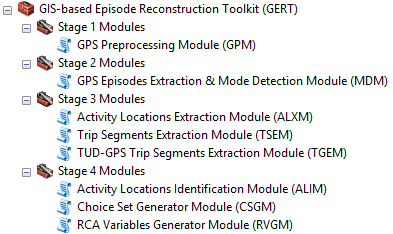
So, how do we make use of the data? The original trip data is not in a particularly useful format – it’s basically just a table with start/end times, coordinates, trip durations, and some other minor variables. There are also the raw GPX files that contain nothing more than a point ID and some coordinates. The first thing to do is process the data with python to convert .GPX trip files to a .CSV to make it into a more workable format. Then the .CSV file is brought into RStudio (a development environment for the R statistical language used for data analysis and manipulation) and enriched using data from the trip table. This gives each GPS point an exact time when it was recorded, allowing the full route to be ascertained. At this point, the data is brought into a comprehensive tool called the GIS-based Episode Reconstruction Toolkit (GERT), which was created by a former lab member, Dr. Ron Dalumpines. This tool was built using ArcPy and features multiple stages with modules for processing GPS data. The first module used is for GPS Preprocessing. This module takes in raw GPS data and uses data cleaning procedures to remove invalid points. Invalid points are those that contain identical GPS coordinates within a trip, and outliers (e.g. points that have speeds greater than 50m/s).
The next step is to bring the data into the GPS Trip Segment Extraction Module (TGEM). This module takes the sequences of GPS points that comprise a unique travel episode using the start and end times of each point. The resulting GPS trajectory is then exported as a unique shapefile.
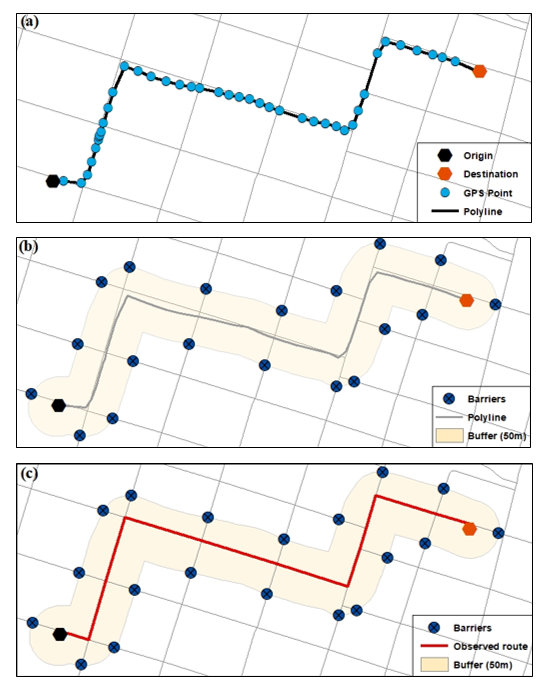
These shapefiles provide a great visualization of GPS routes and at this stage can be used for spatial analysis, but in order to take advantage of the Network Analyst tools inside of ArcGIS they need to be matched to an actual road network. As part of my research, I have constructed a cycling network for Hamilton that combines roads and trails (both official and unofficial). Since cyclists do not have to always travel on roads and in some cases don’t even follow the correct direction of traffic, the network was constructed with the goal of successfully matching with as many GPS trajectories as possible. In a nutshell, the map-matching tool converts the GPS points into a polyline, then creates a buffer around the line. All the network features inside the buffer are then selected and the route solver inside of Network Analyst determines the shortest path between the first and last point, creating a new shapefile of the now network or map-matched route.
Unfortunately, the map-matching process takes a while to run. For my thesis, I am going to complete the process for every SoBi trip made in 2018, which will likely take an entire month to complete, and that’s with 3 different computers running the process in 3 different instances of ArcMap at the same time. On the bright side, it gives me some time to start writing my thesis!
I hope you found this interesting! If you would like to learn more about the tools involved in making this work I have included some links below.
Thanks for reading,
Matt
For more information on the GERT tool: http://hdl.handle.net/11375/15956
For more information on the map-matching process, the full article can be requested here: https://www.researchgate.net/publication/221612116_GIS-based_Map-matching_Development_and_Demonstration_of_a_Postprocessing_Map-matching_Algorithm_for_Transportation_Research


