

Like all other events, whether professional, academic or even social, GIS day events at Western went online this year. The organizers of GIS day at Western, Western Libraries, put together four days of free online lightning talks, workshops, demonstrations and networking sessions. Due to the online format, students and professionals from across and even outside Ontario were able to attend and present in Western Libraries’ thematic sessions. I had the chance to present some of my masters research on detecting feral swine social structures from here in the Geography and the Environment Department at Western in a lightning talk during a drop in session with other ECCE associates and directors. Here is a brief outline of the research I presented, which is a continuation of my research that I have previously written about in this blog.
My thesis research is on GPS tracking the invasive species of feral swine in Oklahoma. One of our research interests is detecting feral swine social structures, as these play an important role in their harmful effects such as disease transmission, and can influence the movement of individuals as well. To detect social structures between feral swine in the study area using GPS tracking data, we first detect contacts between individuals (e.g., individuals <100 metres apart within a few minutes timespan) over the course of the study period. We can use the number of contacts between individuals to quantify the strength of their association, and model a social network from the observed GPS tracking data. However, since animals can come into contact with each other for a variety of reasons such as social behaviour or landscape effects like the distribution of resources or barriers, more testing is needed to determine if the contacts we observe are social in nature.
To test if the association rates between individuals were caused by social behaviour, the GIS tracking data was shuffled by day, while movement trajectories within each day were preserved. Then, using the randomized GPS tracking data, contacts were again detected and a social network reconstructed. This way, any synchronized movement between individuals would be interrupted, since the shuffled trajectories used to detect when and where contacts occur are no longer temporally synchronized. To achieve this in R, we added a new column and rows to our GPS tracking data to assign a randomized day, where the randomized day takes rows belonging to an observed day and basically switches the date value uniquely for each individual (i.e., one individual’s day 1 becomes day 3, another’s becomes day 2, etc.).
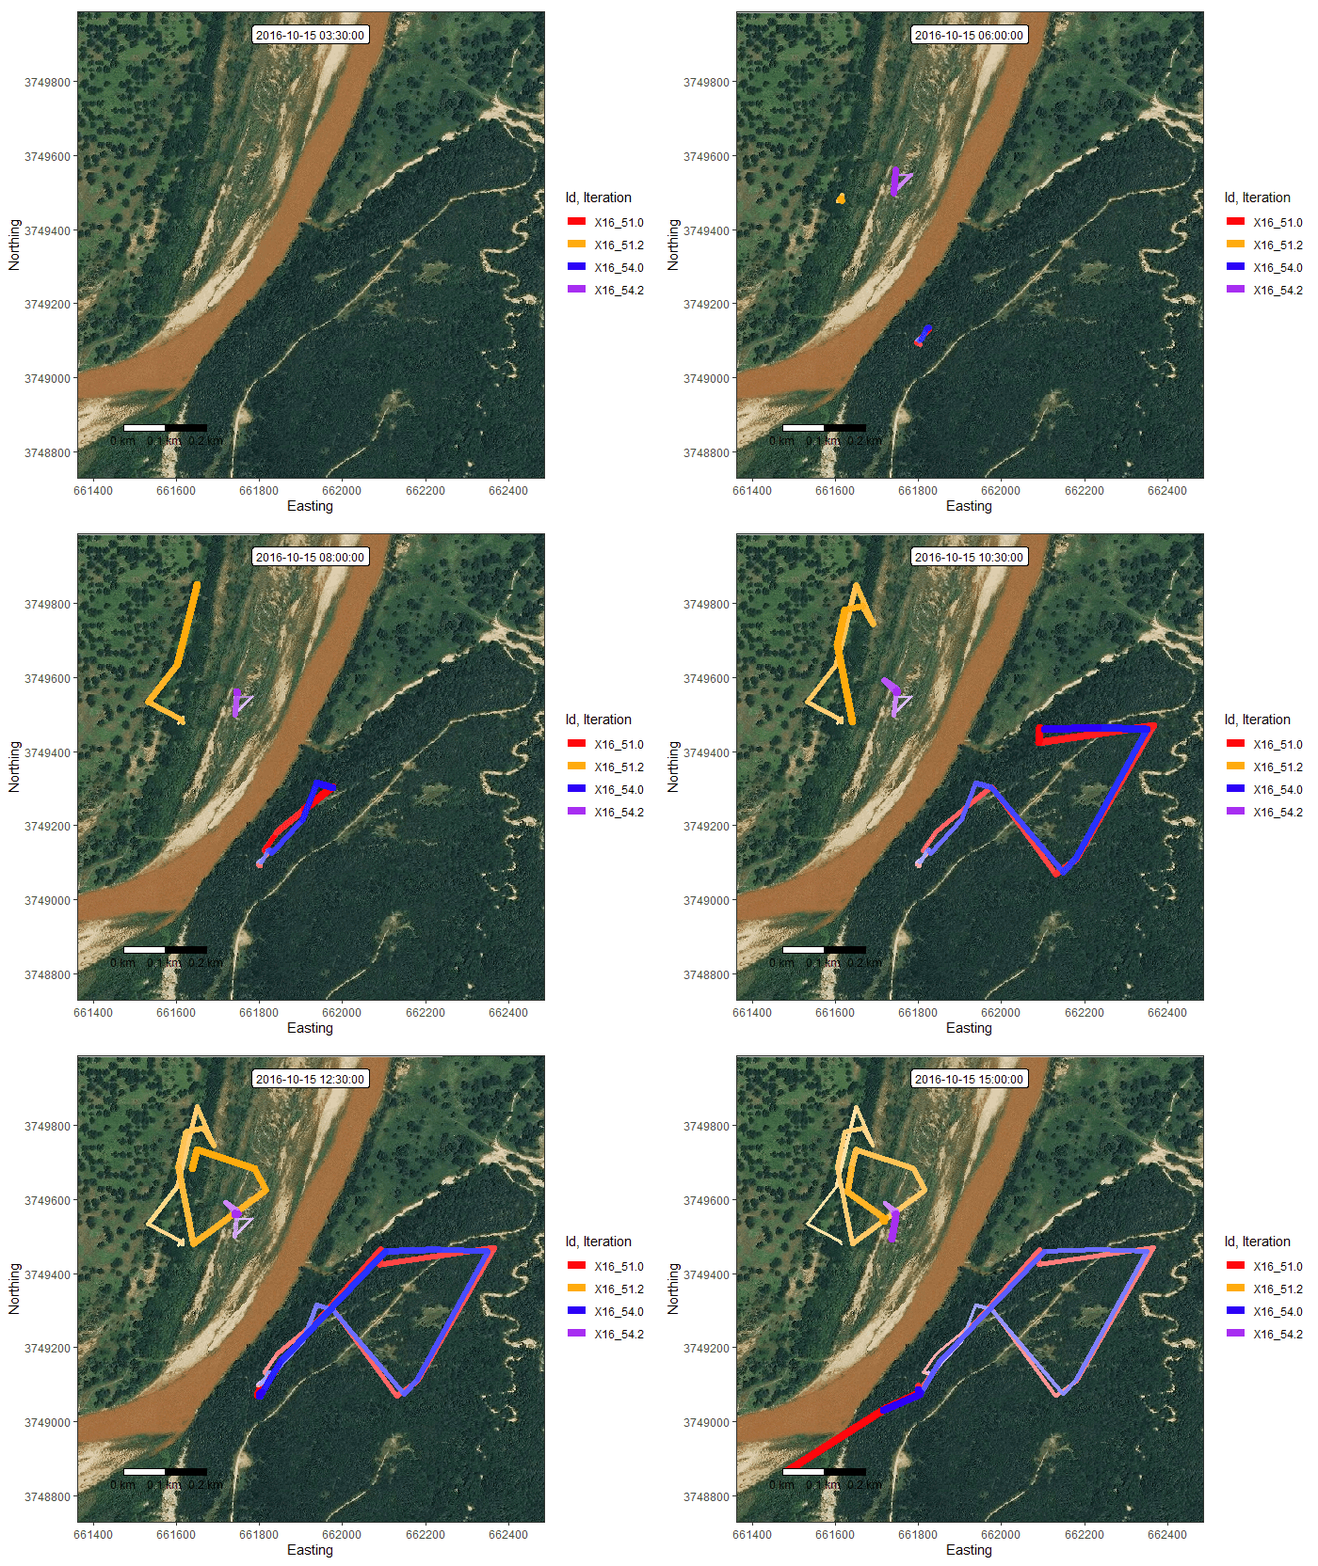
It is expected that we would see a difference in the contacts between observed GPS tracking data versus the randomized GPS tracking data, which would indicate that the observed association rates are dependent on the synchronous movement between individuals. For individuals where this is the case, we now have some evidence that their association is likely social in nature, indicating that they could belong to the same social group. Being able to get evidence of social organization of multiple GPS tracked individuals in the study area can give us important insights into the potential for harmful effects such as disease transmission. Further, properties of the social group, such as how often and when two individuals in the same group are together can help us understand how and when groups might form or break apart, what other factors might influence group behaviour (e.g., resource distribution), and detecting other behaviours such as parturition.
With my masters program nearly 3/4ths complete, we have been able to achieve some interesting results using these methods. These results leave us with lots of questions and interesting directions for our work going forward. In the meantime, sharing our progress at virtual events can feel less exciting than travelling to conferences to present in-person, but also provides some upsides that likely wouldn’t be possible otherwise. For instance, while GIS day events were always free in the past, the most recent GIS day event at Western was able to attract and host a larger and more diverse number of participants and presentations from across Ontario, Quebec, and even a few internationally. For this, I choose to look on the bright side, though I’m cautiously optimistic we’ll be able to meet again in person for GIS day 2021.