Hi all!
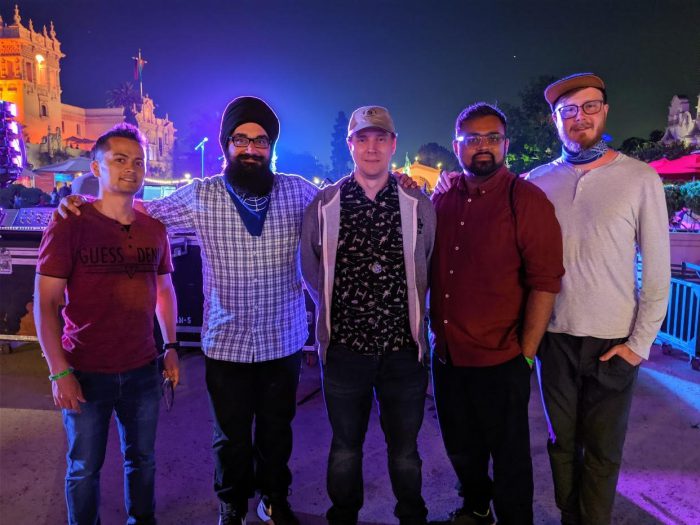
This is Manpreet from UW! This past year I had the great opportunity to have been able to attend the Esri International User Conference in San Diego from July 8-12. I received this opportunity along with some fellow grad students at UW from winning the annual ECCE App Challenge held in 2019. We built an app called SMART (Sustainable Management Augmented Reality Technology) that is designed to showcase sustainable urban development initiatives in augmented reality and have user feedback from citizens living in or near where these initiatives are occurring. I encourage all ECCE student associates to participate in the app challenge. It is a wonderful opportunity to participate in a project that helps build teamwork skills and allows for students to push their GIS skills past their limits. A big thank you to Esri Canada for organizing this challenge annually and providing the winning team with an opportunity to attend this international conference.
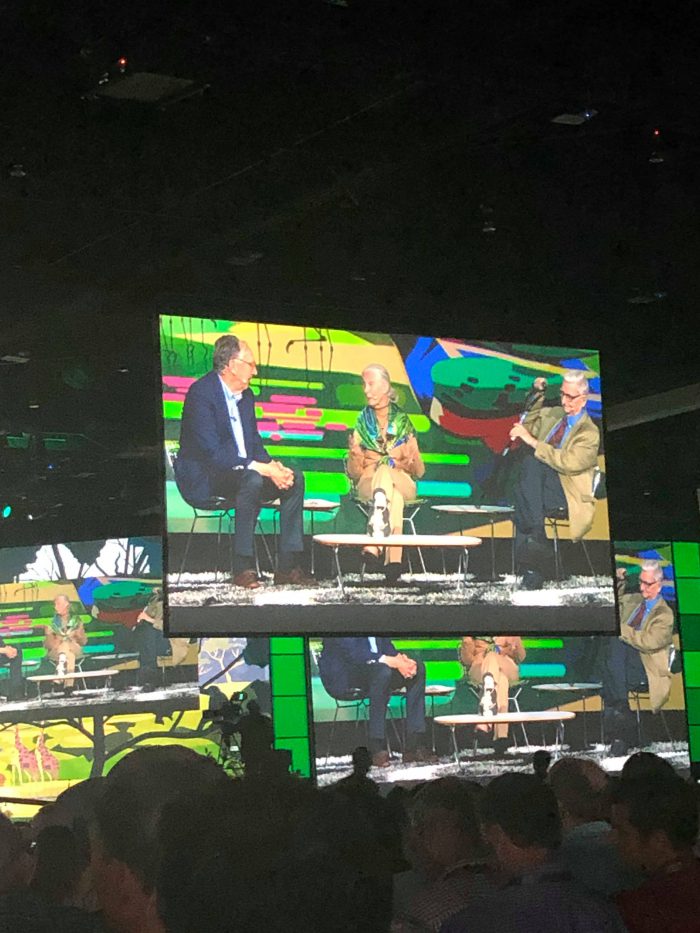
The Esri International User Conference in San Diego was a 5 day conference. On Day 1, Jack Dangermond, the president of Esri, hosted the main plenary session. Various topics in the advancing world of GIS were presented. Some topics that stood out to me during the session included field operations, 3-D visualization/analysis, story maps, Insights for ArcGIS, ArcGIS App Builders, the JavaScript API, Business Analyst, indoor mapping, ArcGIS Hub, and ArcGIS Urban. In addition, there were several guest speakers from all over the world from various organizations that gave a talk during the plenary session as well. Some of these organizations that stood out were GIS for Peace, National Geographic, The Jane Goodall Institute, and the E.O. Wilson Biodiversity Foundation. Jane Goodall and E.O. Wilson had a great conversation with Jack Dangermond on the climate crisis and preserving biodiversity. In the evening, one of the members of my app challenge winning team, Jaydeep Mistry, gave a lightning talk on our app. Then we were able to have dinner with some of the folks from Esri Canada.
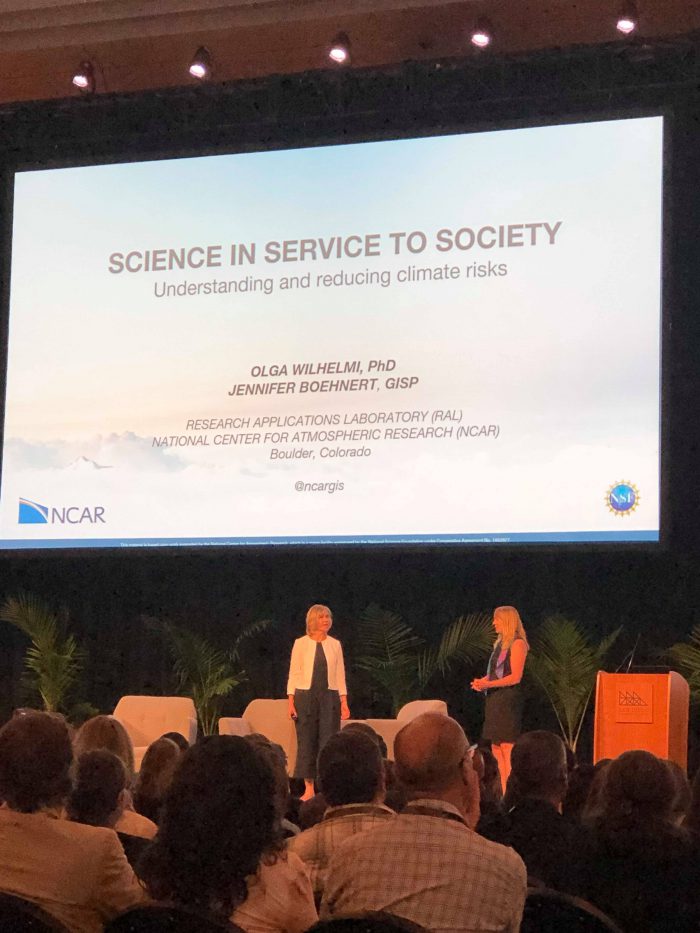
On Day 2, I was able to attend some of the breakout sessions held in the morning such as ArcGIS Hub, which is a cloud platform that organizes people, data, and engagement tools to accomplish initiative goals. I was also able to walk the expo floor which hosted hundreds of vendors from all over the world. There were also demo theatres at the back of the expo floor where more hands-on presentations were given such as 3-D visualization techniques with GIS. There were also very interesting Virtual Reality GIS tools and equipment that were showcased on the expo floor as well. In the evening of the second day, there was a Science Symposium held where all attendees received a free book on GIS for Science! A keynote session was given titled Science in Service to Society – Understanding and Reducing Climate Risks, presented by Olga Wilhelmi from Research Applications Laboratory and Jennifer Boenhert from National Centre for Atmospheric Research in Colorado. Overall, the takeaway messages were that climate and society are co-evolving in a manner that can place more people at risk from weather-related hazards including coastal flooding, drought, fires and heat waves. Extreme heat and climate are public health threats. The number of harmful heat events is increasing. Health risks depend on exposure, vulnerability, and capacity to prepare, respond and adapt. As society learns to deal with rapidly changing environmental conditions, the need for relevant information and services continues to grow. After this, I attended the Esri Canada Party where I was able to network with other industry professionals that came to the conference from Canada.
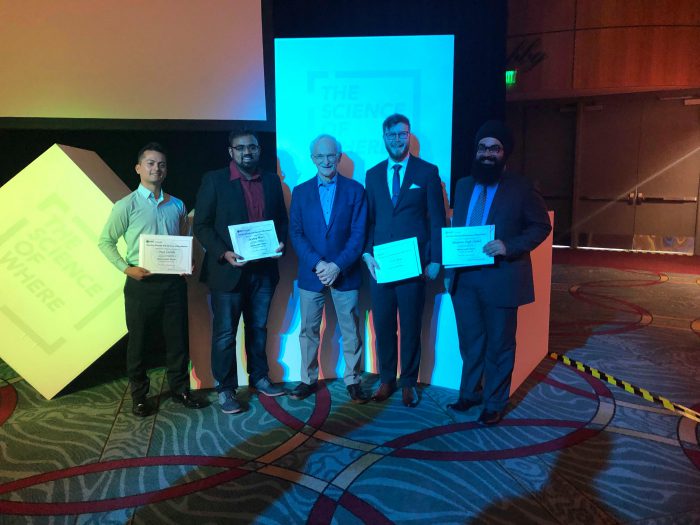
On Day 3, I attended a breakout session on ArcGIS Urban, which visualizes urban environments in 3-D and provides capabilities such as public engagement, which I am currently employing in my Masters thesis. During the session, I was able to learn that ArcGIS Urban is an interactive 3-D environment, it provides search and filter, pre-authored indicators, Operations Dashboard integration, and allows for crowdsourcing of public ideas. It can also integrate with City Engine, which allows for streetscape modelling, interactive analysis, mobile VR authoring, and game engine integration. Another session focused on City Engine, which allows for the use of 2-D data and attribution to generate large urban models that can report back metrics based on geometry, be analyzed in traditional GIS, and iterate quickly through scenarios and quickly report and publish. Later in the day, my team and I attended the Esri Awards Ceremony, where we received certificates from Esri Canada on winning the app challenge and got to take a photo with Alex Miller, the president of Esri Canada and Jack Dangermond, the president of Esri! A big thank you to Esri Canada!
On Day 4, I attended a breakout session on virtual reality, augmented reality and mixed reality GIS. Virtual reality provides an artificial environment where VR users immerse themselves an interact with multimedia content. Augmented reality is the overlapping of textual, graphic and multimedia information to the world observed by the user. Mixed reality is an integration of digital objects into the physical world. It enables users to interact with artificial objects displayed within their field of vision. Finally, I attended a session on JavaScript API. Later in the evening, Esri held a party to signal the end of the conference. I had a great time and was able to network with many different people from Esri Canada as well!
In October, I attended the Esri Canada User Conference in Toronto for the second time. This time, I was able to attend both days. On Day 1, the plenary session was hosted by Esri Canada President, Alex Miller, and focused on GIS as an Intelligent Nervous System. There were some great guest speakers as well. The one that really caught my eye was the Missing Children Society of Canada, which is using GIS technology to do some really important work in locating missing children throughout Canada. Some of the breakout sessions I attended included ArcGIS Hub used for community participation in cities throughout Canada. On Day 2, the plenary session gave me some important insights on Operations Dashboard, Field Operations, Quick Data Capture, Hosted Python Notebooks, ArcGIS App Builders, and deep learning with GIS. A breakout session I attended that really caught my eye was a Couple Lines of Code, which was a presentation on using programming languages such as Python and JavaScript API with GIS. I was able to attend this conference with some of my friends from UW. There were a lot more attendees than last year and I was able to network with some industry professionals that had booths set up on the expo floor.
Overall, both user conferences I attended in 2019 were extremely memorable. I highly recommend that all ECCE student associates attend as many user conferences as they can, especially the international user conference held in San Diego in July. That was definitely one of the most memorable conferences I have ever attended!


