
This is the first in a multi-part series detailing the process of linking in-situ peatland water table data to satellite data.
While monitoring the water table, or moisture status of a peatland is by no means a complicated task that is usually accomplished simply with a groundwater well, they beg the question of ‘ungauged basins’ that was the theme of the International Association of Hydrological Sciences (IAHS) decade 2003-2012. Simply put, it is not possible to monitor everything, everywhere, all the time. In such cases, one has to predict, both in the past and future by establishing relationships with other relevant datasets.
Remotely sensed data offers a powerful opportunity in this realm as satellites ‘see everywhere’ spatially (at least the surface or above) with more data than the naked eye and with archives into the past. In the case of the USGS/NASA Landsat satellites, multispectral imagery has been collected since the 1972 at up to 30 m spatial resolution, at a frequency of 16 days. The more recent ESA Sentinel satellites only have contemporary data as far back as 2014 but feature improvements of higher spatial resolution up to 10 meters, shorter return intervals of 6 days and active remote sensing in the form of Sentinel-1’s C-band synthetic aperture radar (SAR). In recent years, cloud computing through Google Earth Engine has greatly expanded the accessibility of this data to users.
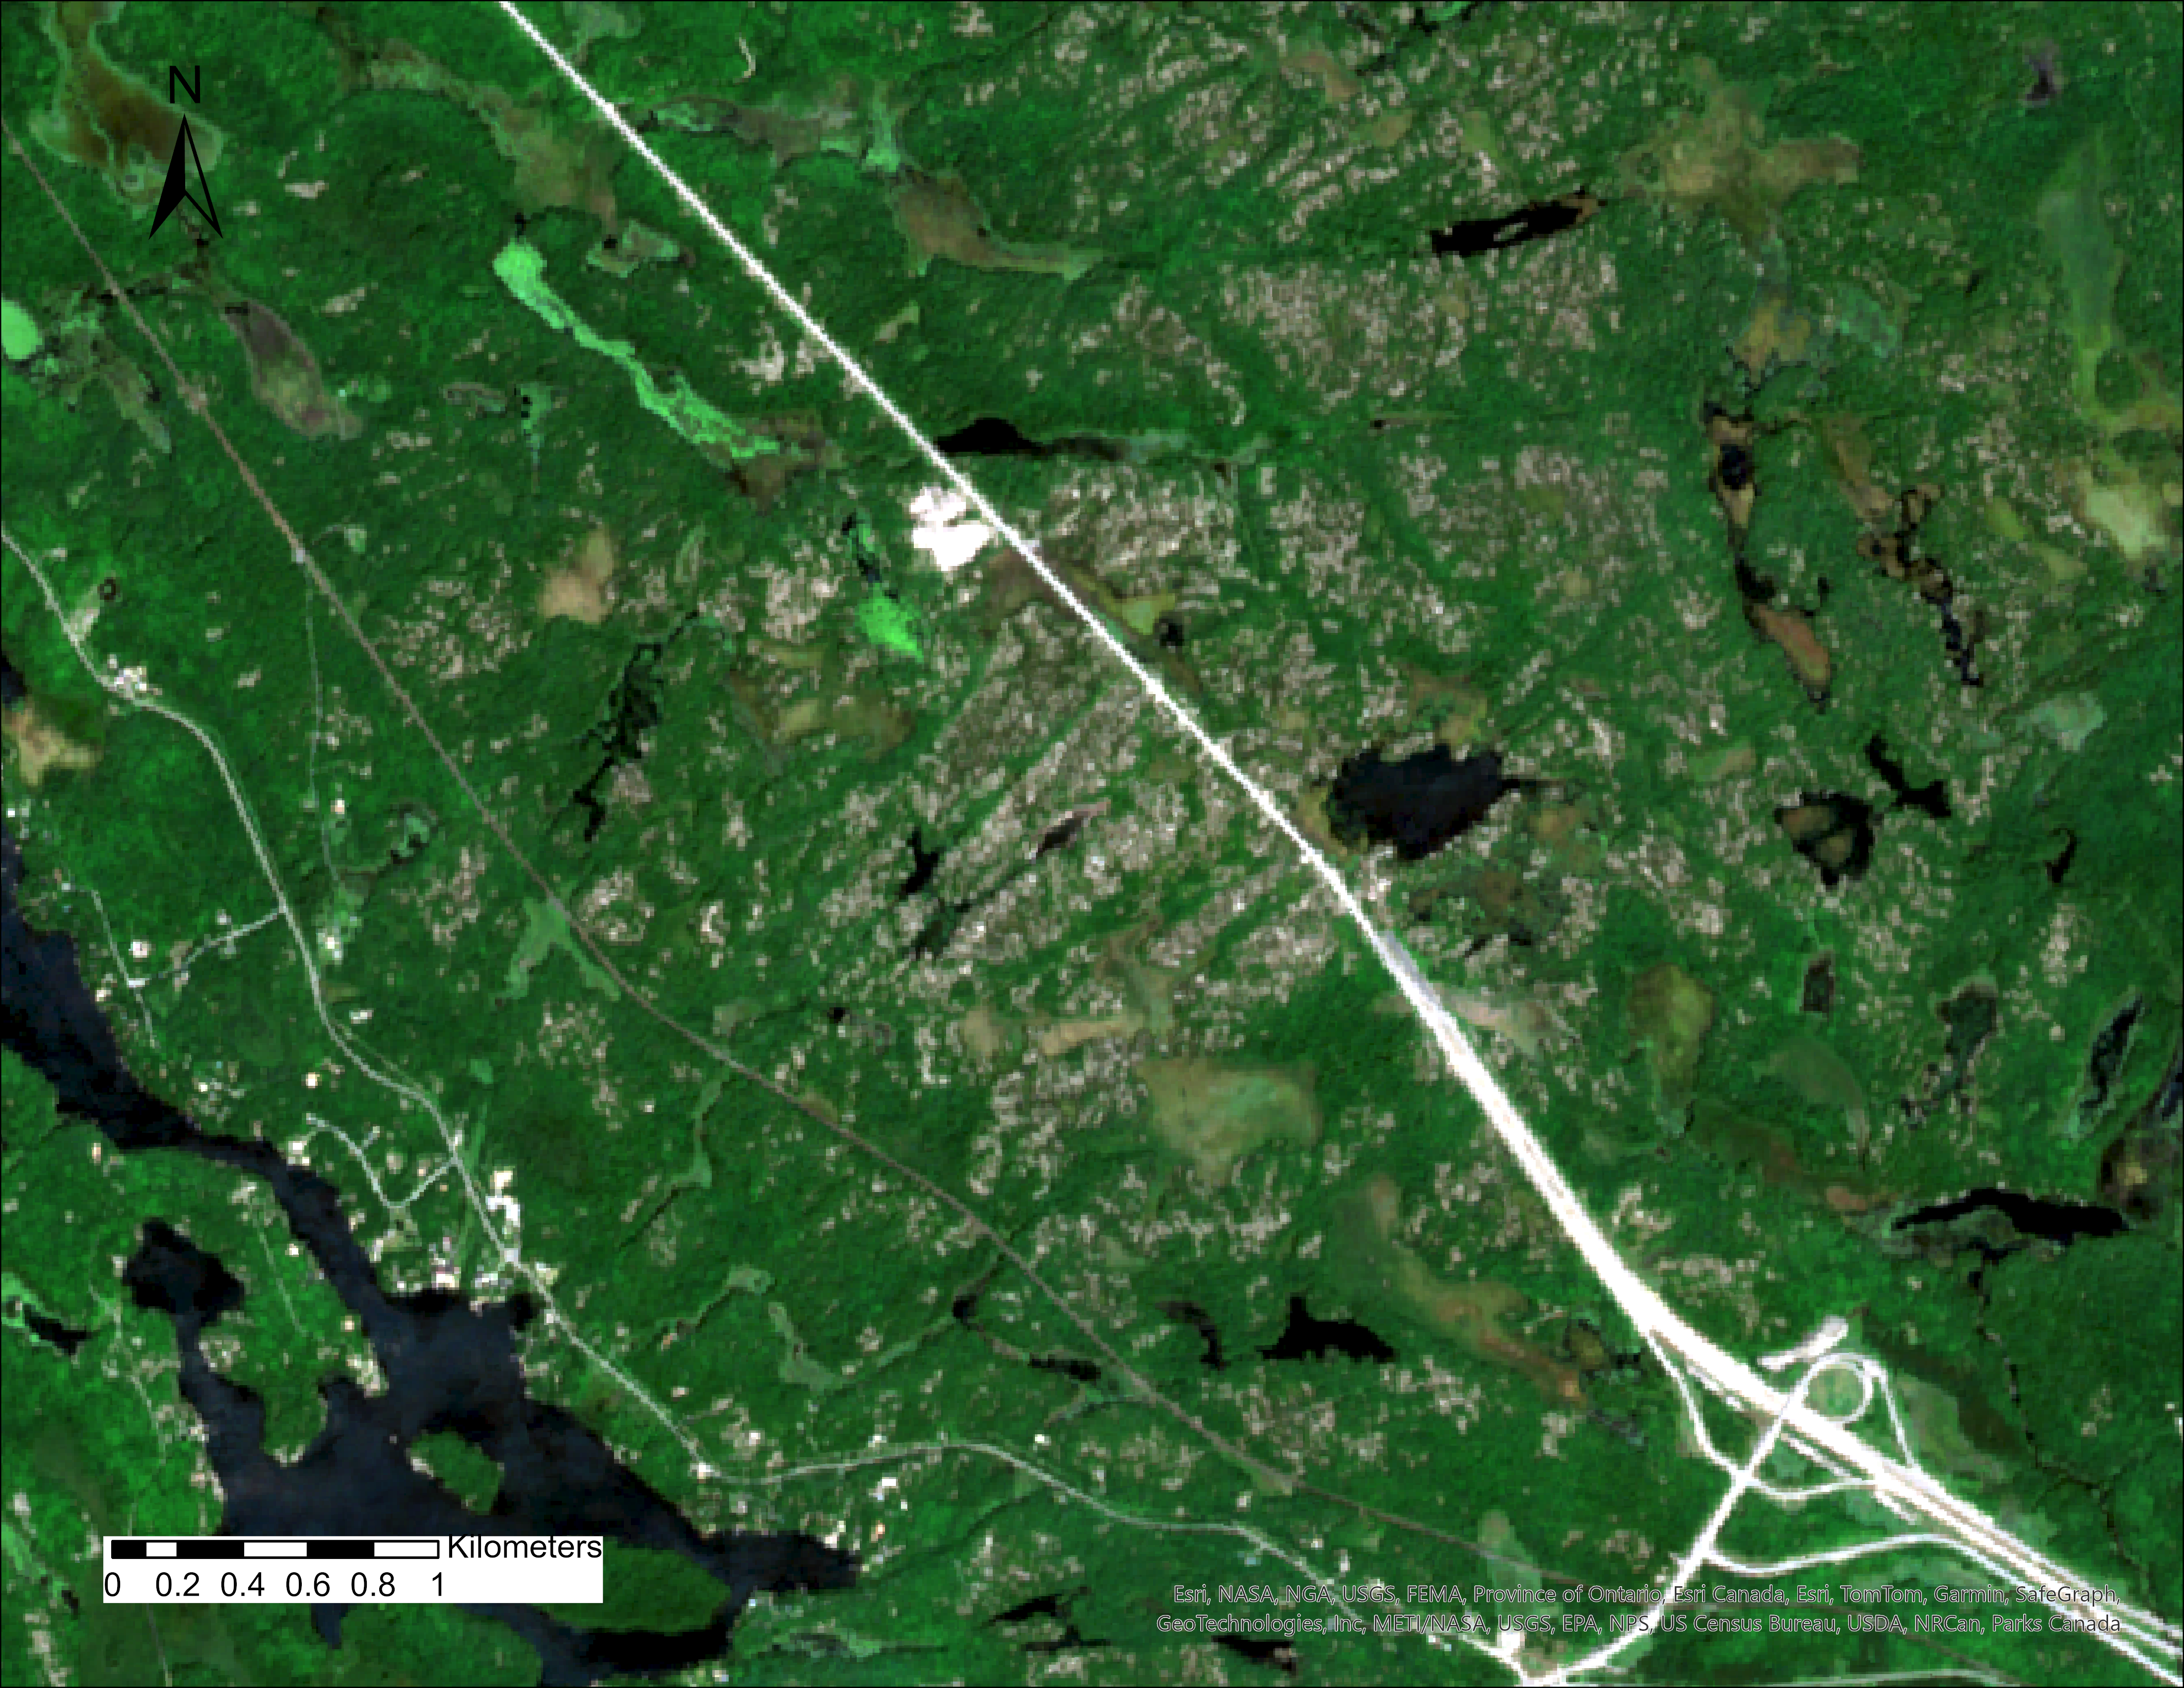
For the Boreal Shield bedrock depression peatlands that my lab studies in the Georgian Bay region, they range in size from about 100 m2 to over 100,000 m2, so if we are to hope to ‘see’ them with satellite data Sentinel is the preferable option to minimize mixed pixels. There have been recent developments in using Sentinel products in the detection of peatland water table (e.g. Räsänen et al. 2022 and Burdun et al. 2023), but in much more expansive peatlands where spatial resolution is not a concern. The objective of this thesis chapter is to test similar techniques to determine if they can be used to predict the moisture status of these smaller peatlands, and to what resolution (what size peatland, how deep water table to what detail)? The large number of individual peatlands across this mosaic landscape would makes this a potentially invaluable tool for monitoring peatland health, for these drought (Moore et al. 2021) and wildfire vulnerable (Wilkinson et al. 2020) systems.
One of the outstanding questions for this task is in the fourth step. That is, to where should the Sentinel data be extracted to? For most cases of linking ground data to remotely sensed, one usually aims to match the location as accurately as possible, which would be extracting the data from the location of the groundwater well at each peatland. However, the location of the wells is not always ideal due to being under canopy, or closer to the peatland margin than may be ideal so another option is to use the peatland centroid as the focus. A third option is to average out the pixels captured throughout the peatland polygon. The former two standardize the ‘zones’ being compared at the risk of including partial pixels for the smallest peatlands, whereas the latter restricts the data to just the peatland but leads to wide variation in what is being ‘seen’ (1 to >1000 pixels).
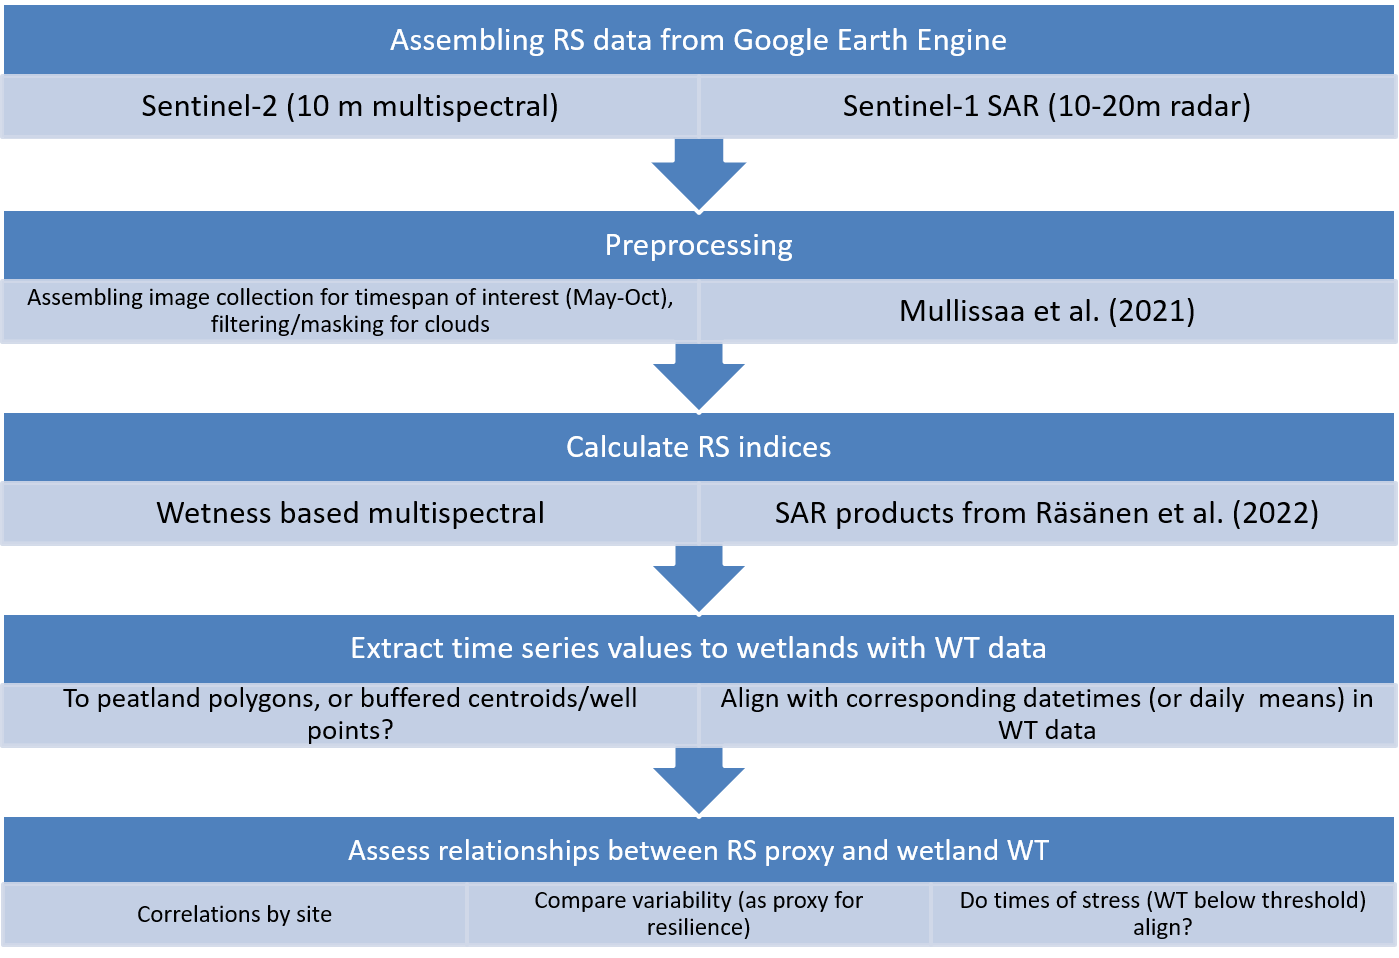
While most of this analysis is to take place in Google Earth Engine, this preliminary analysis involved importing a Sentinel-1 ‘image’ to ArcGIS Pro, and using zonal statistics to calculate the average and variation within pixels collected by these means, using the well point or peatland centroid buffered to 10 m, or the peatland polygon in its entirety as the ‘zones’
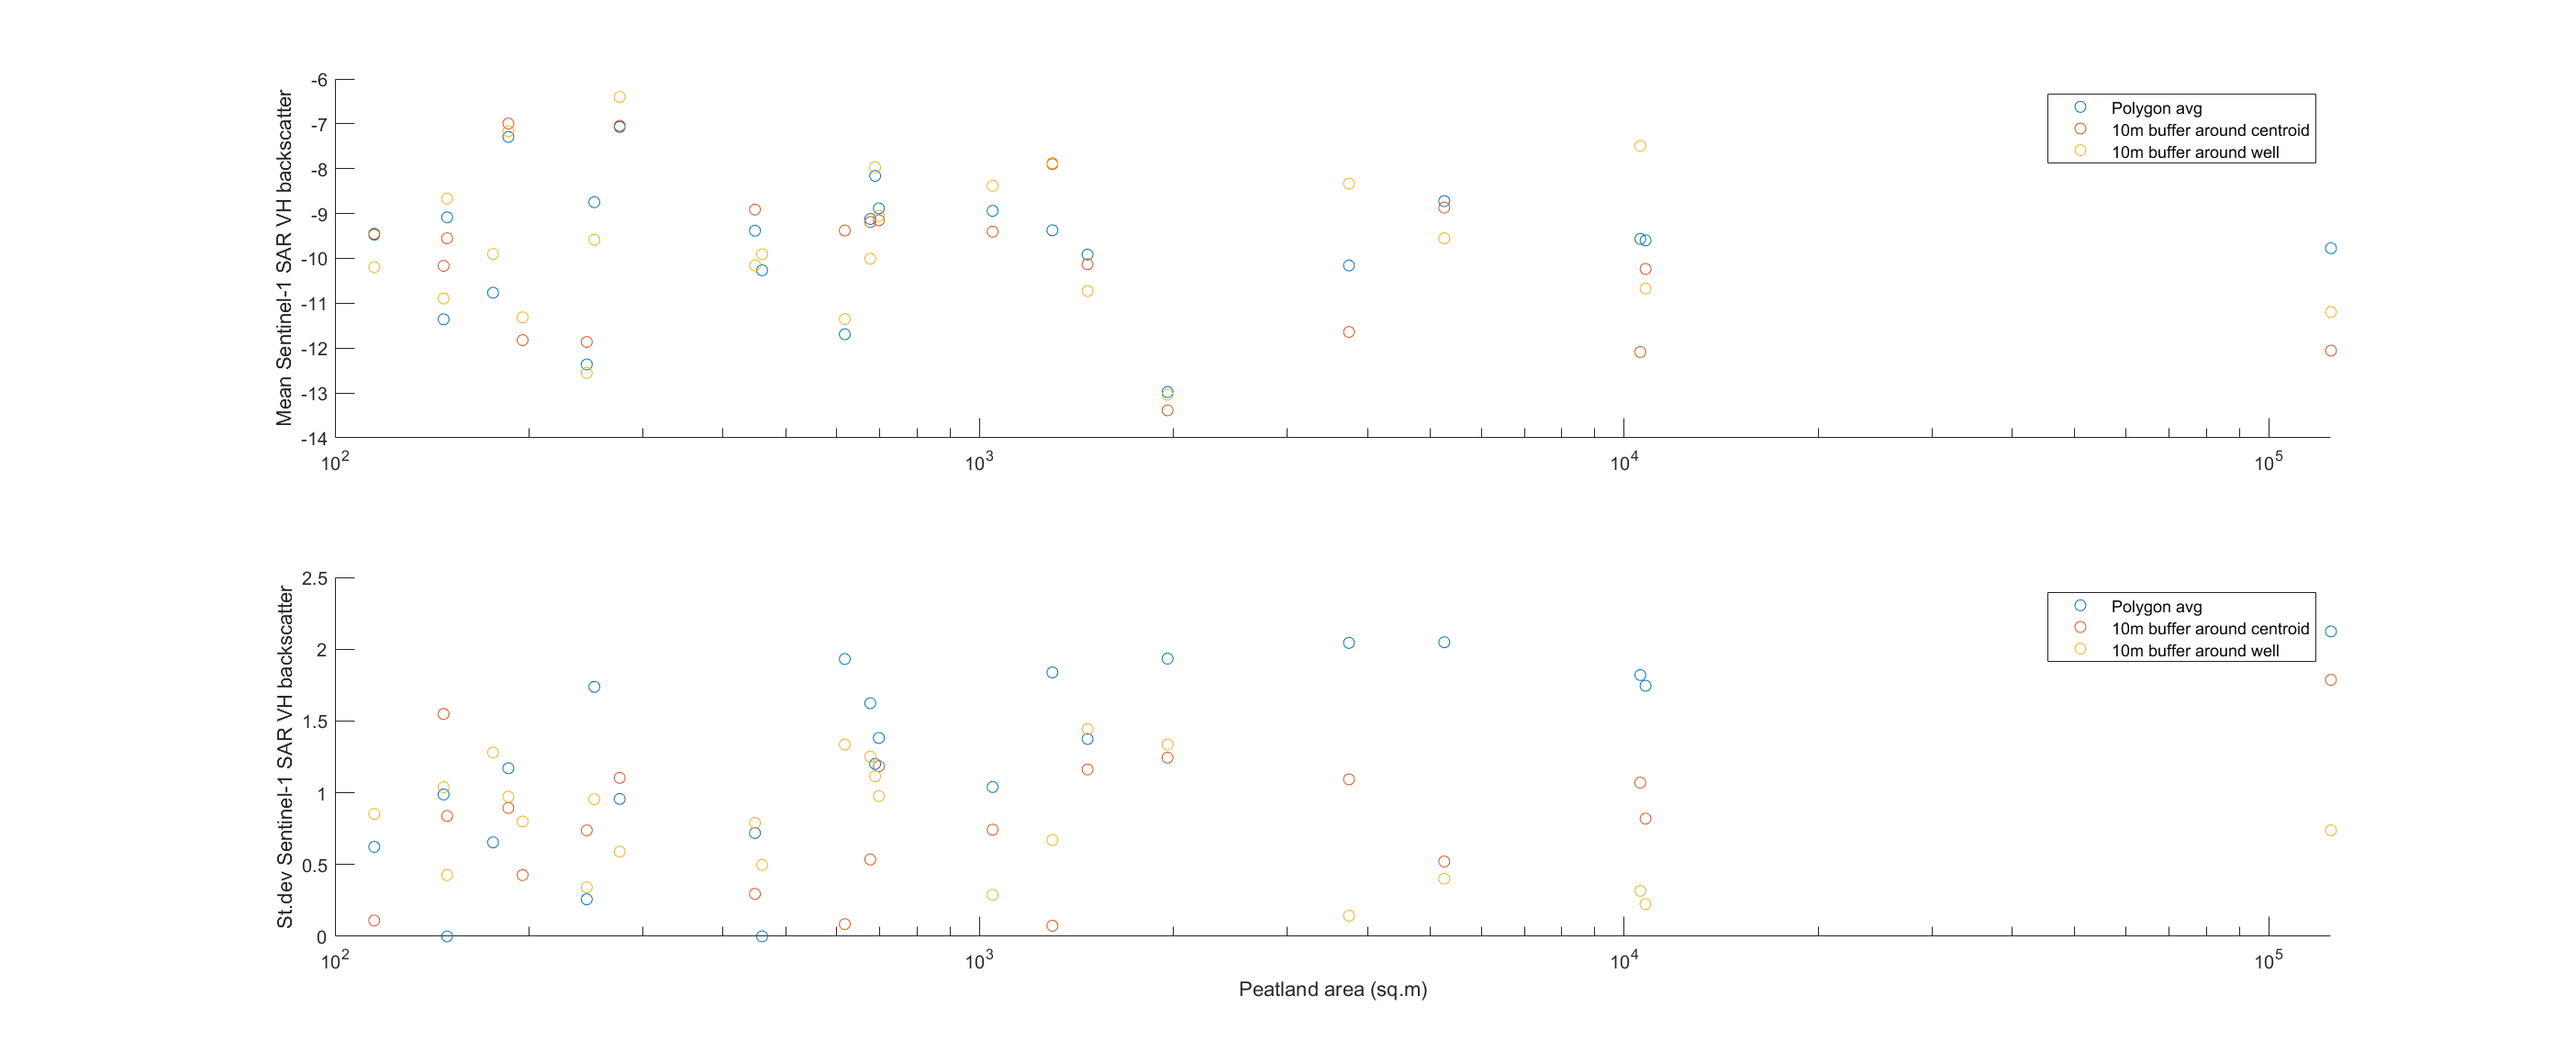
As a test, I ran a comparison of these methods for one Sentinel-1 image to gauge if it will be consequential going forward by calculating the mean SAR VH backscatter, and standard deviation therein of the cells captured by the three methods. For the most part, the mean backscatter values are within 2dB of each other with the exception of about three peatlands at of sizes of about 600, 4000 and 10000 m2. While greater spread is to be somewhat expected for peatlands on the larger size, due to greater possible variation, the two smaller peatlands are notable for persistently wet or inundated areas. For the standard deviation of VH backscatter among the different methods, the highest values are about 2dB, and most commonly by collecting the entire peatland polygon of larger peatlands. This shifts to there being the most variation around the well or centroid in smaller peatlands, potentially by picking up mixed pixels outside the peatland proper. Given the total range of VH backscatter values are observed is less than 10dB, these variations will need to be addressed in some form to ensure there is sufficient signal-to-noise to build a relationship between Sentinel satellite data and on-the-ground water table data.
The next step (5) in this process will be determining which method offers the greatest sensitivity of what the Sentinel satellite ‘sees’ and the actual position of the water table.
References
Burdun, I., Bechtold, M., Aurela, M., De Lannoy, G., Desai, A. R., Humphreys, E., Kareksela, S., Komisarenko, V., Liimatainen, M., Marttila, H., Minkkinen, K., Nilsson, M. B., Ojanen, P., Salko, S.-S., Tuittila, E.-S., Uuemaa, E., & Rautiainen, M. (2023). Hidden becomes clear: Optical remote sensing of vegetation reveals water table dynamics in northern peatlands. Remote Sensing of Environment, 296, 113736. https://doi.org/10.1016/j.rse.2023.113736
Moore, P. A., Didemus, B. D., Furukawa, A. K., & Waddington, J. M. (2021). Peat depth as a control on Sphagnum moisture stress during seasonal drought. Hydrological Processes, 35(4), e14117. https://doi.org/10.1002/hyp.14117
Räsänen, A., Tolvanen, A., & Kareksela, S. (2022). Monitoring peatland water table depth with optical and radar satellite imagery. International Journal of Applied Earth Observation and Geoinformation, 112, 102866. https://doi.org/10.1016/j.jag.2022.102866
Wilkinson, S. L., Tekatch, A. M., Markle, C. E., Moore, P. A., & Waddington, J. M. (2020). Shallow peat is most vulnerable to high peat burn severity during wildfire. Environmental Research Letters, 15(10), 104032. https://doi.org/10.1088/1748-9326/aba7e8