
ArcGIS Urban For Visually-Oriented Collaborative Planning
The analytical power of GIS has benefitted just about every industry. The nature of the GIS discipline also lends itself particularly well to urban planning. In response, and about eight years after the debut of CityEngine, Esri released ArcGIS Urban which is a web-based urban planning application. Whereas CityEngine is primarily a 3D mass urban modeling tool, ArcGIS Urban is geared more towards the urban planning side of things, with features that allow city-wide plan management and project tracking, development visualization and impact assessment, and public crowdsourcing, all available through an intuitive interface, no coding required.
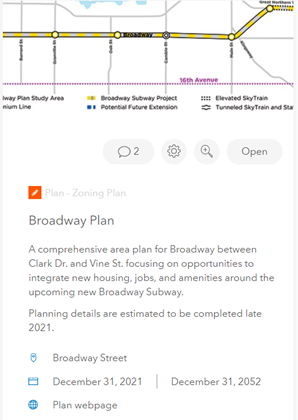
Eager to test it out, I recently explored the use of ArcGIS Urban for a mini project looking at finding potential areas for development under the objectives of two plans relating to the City of Vancouver, BC, Canada: Metro Vancouver 2040, a regional growth strategy aimed at accommodating future projected population growth in terms of both residential and employment needs; and the Broadway Plan which focuses on centering new development around future subway stations. Plans typically refer to large-scale, long-term development (5 – 50 years) and are assessed in ArcGIS Urban primarily through the use of zoning areas, parcels, and indicators.
ArcGIS Urban requires you to follow a specific workflow when organizing and uploading your data. Space use, zoning, land use, and building type information must be entered manually or imported before uploading the corresponding zoning and land use data layers, in that order. Space use types indicate the allowed use or purpose of a space in a building such as an office or commercial space, and users can add information on Net Area Factor, Floor Height, expected number of jobs per m2, and more. Zoning types must specify one or more allowed space use types and are based on zoning area requirements for the city being modeled.
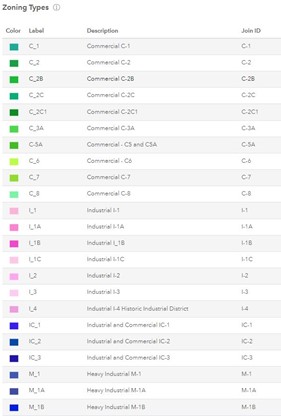
Fortunately for myself, the City of Vancouver’s zoning documentation is easily accessible from their website. Unfortunately, zoning documents can be quite long and dense, so manually extracting the necessary information on restrictions such as maximum coverage, floor area ratio, height, and setbacks was easily the most time-consuming step of the entire process. However, that’s one of the great things about ArcGIS Urban – once you’ve entered all the numbers, all subsequent modeling will reference and apply the zoning limitations automatically, so there’s no need to keep going through the documentation. Furthermore, the implications of zoning restrictions can be understood visually and quantiatively, which I’ll touch on later.
Land use types can also be added with similar fields to input land use restrictions. Building types must also be created, dictating the space use types in each building, their order in the vertical strata, and the range in number of floors allotted to each space use type. Once the types data have been defined, geospatial layers for zoning and land use can be imported, as well as a parcels layer for parcel lots in the study area. To visualize the current urban landscape (displayed as the Existing Scenario), 3D base layers are added to the scene. The most important of these is an existing buildings layer, though other layers such as trees and custom elevation can also be brought in.
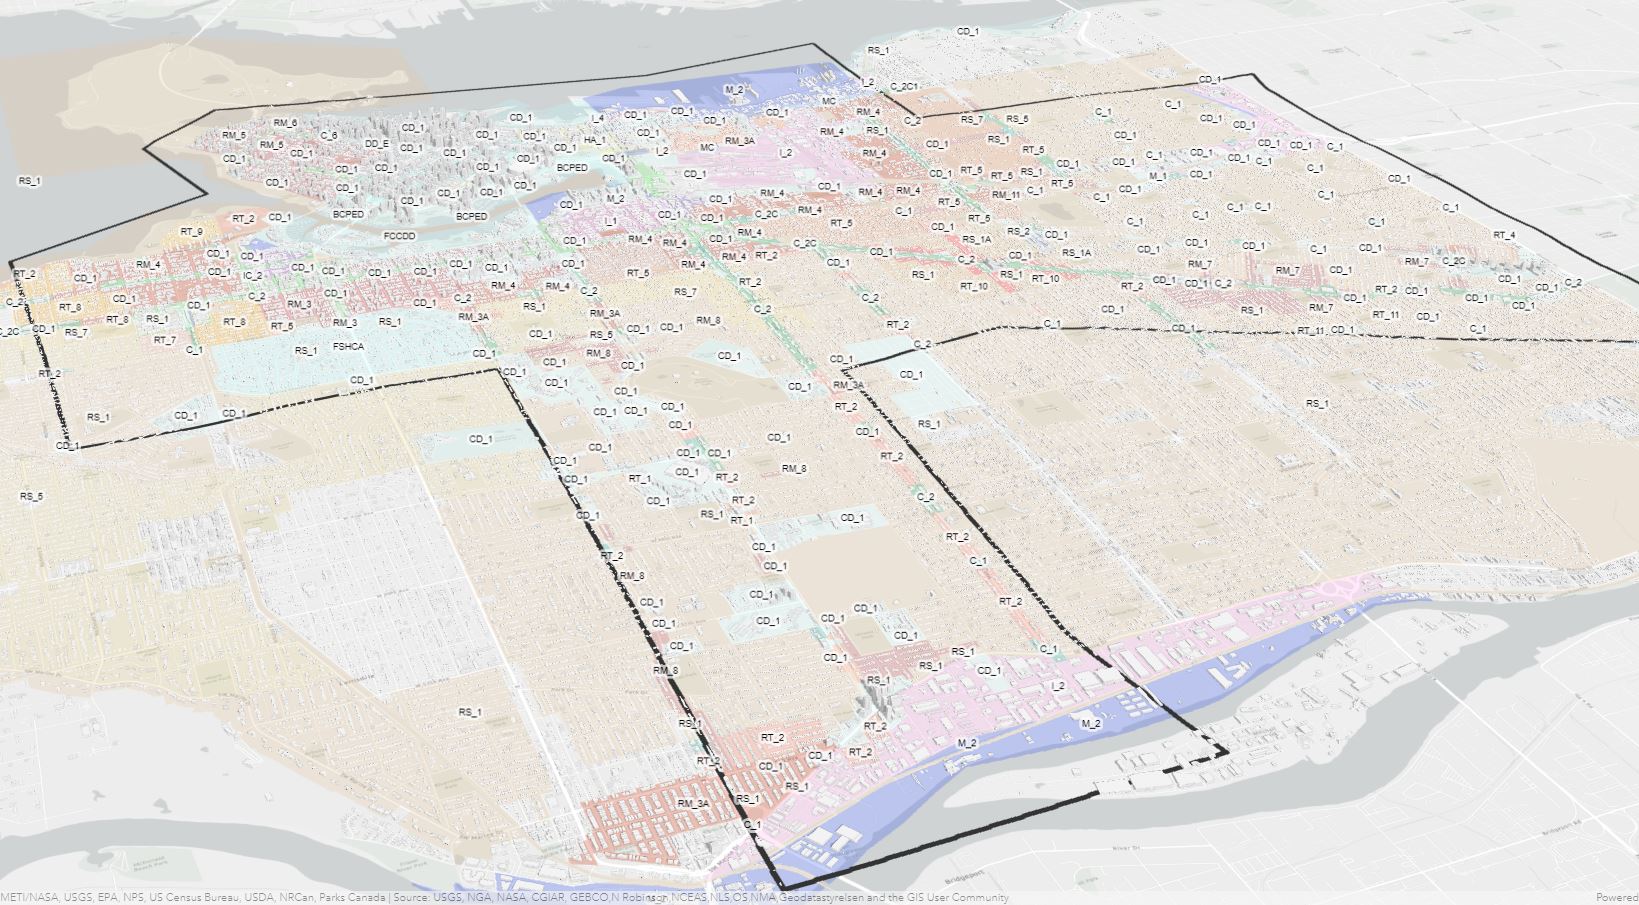
Alternative Scenarios are created using existing or proposed zoning in conjunction with new building types to explore different opportunities for development. Plan context indicators can be imported to guide selection of individual parcels to develop in cases where exact locations have not been determined. For instance, buffers around rapid transit stations can be used as context indicators to identify areas experiencing service voids to help determine where new stations should be established. In my case I used the locations of future subway station locations in the Broadway Plan and frequent transit development areas and the main urban centre in Vancouver for Metro Vancouver 2040, to identify general potential areas for development. ArcGIS Urban also supports informed decision-making with the ability to view the relative suitability of individual parcels based on suitability analysis results if performed prior to importing the parcels layer.
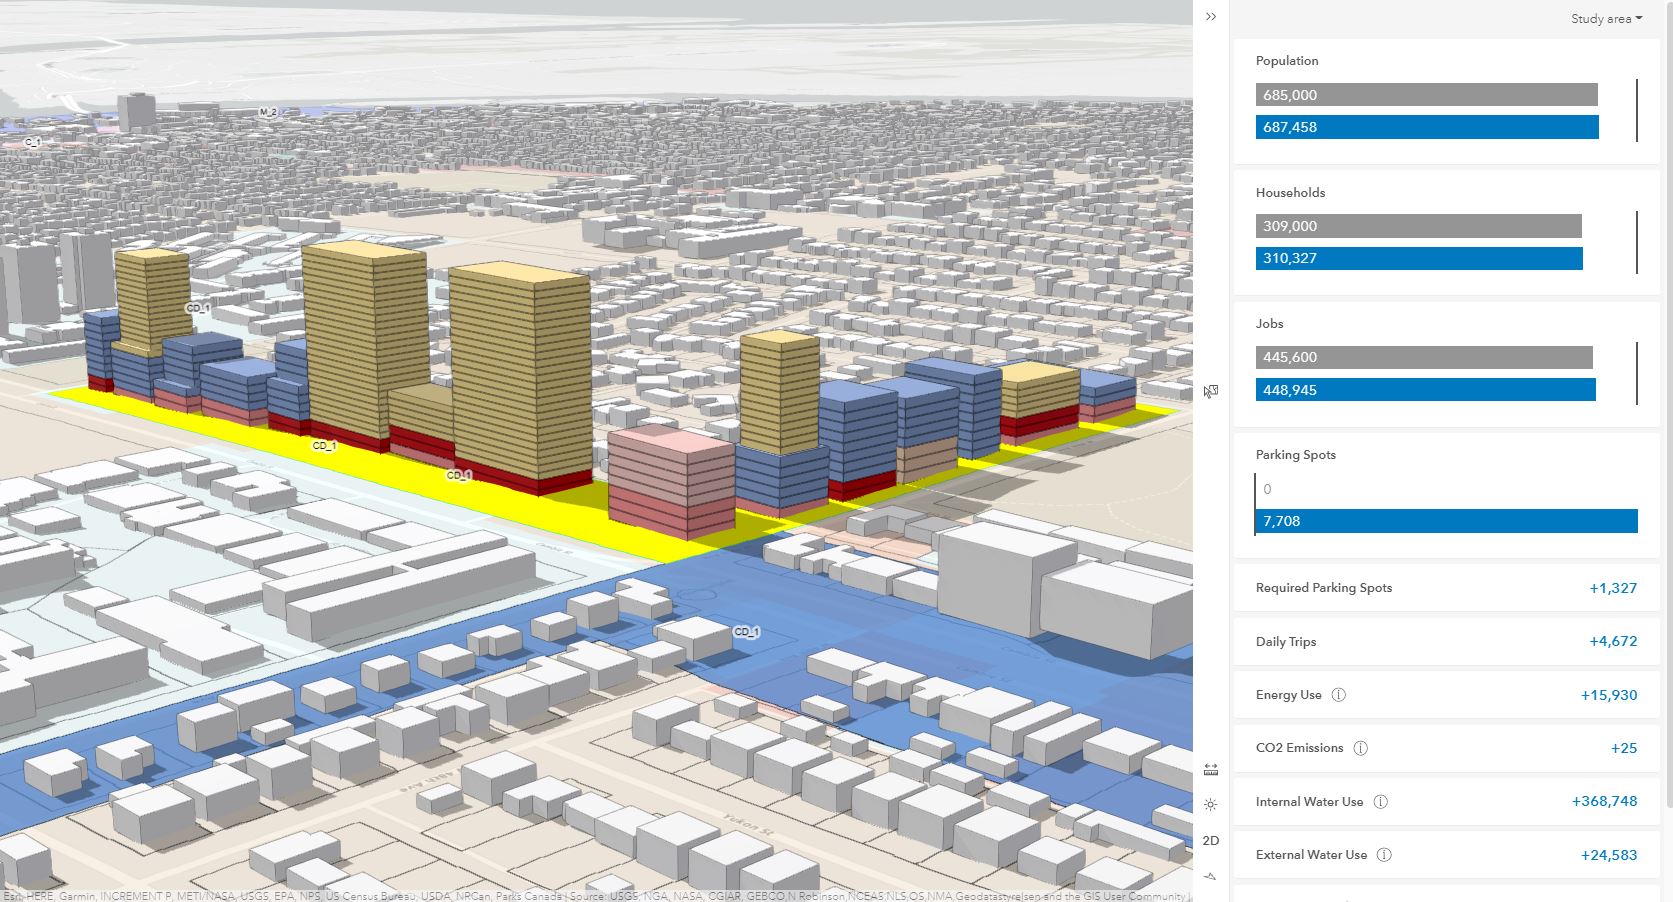
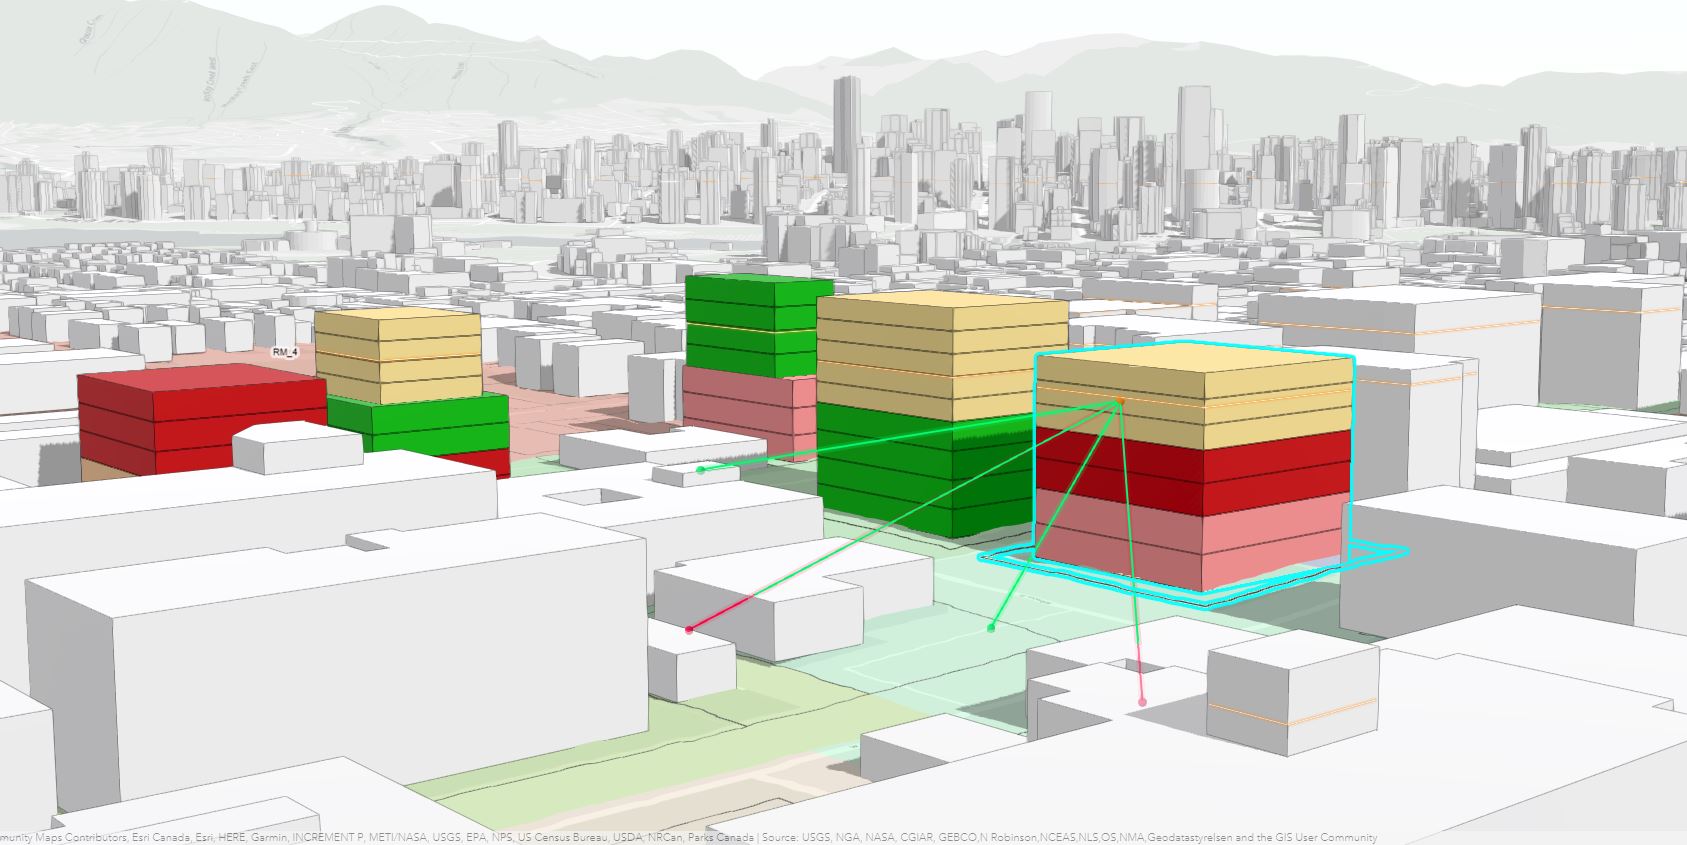
After identifying highly suitable parcels for development, the really fun part begins. In an alternative Scenario, you can ‘demolish’ existing structures and assign Building Types to parcels to generate plausible buildings, or building forms that allow you to visualize possible build-outs based on underlying zoning restrictions. Storeys in the plausible buildings are colour-coded by space use type, and automatically conform to specified restrictions such as maximum height and setbacks. As you create new buildings, built-in Capacity Indicator bar graphs automatically update to communicate how many new jobs, residences, and parking spaces would be created, which you can compare to existing and target numbers if you have the data available.
While the zoning districts themselves are important, it is rarely the case that all buildings in a given zoning area will actually conform to the associated restrictions. For instance, in addition to outright permissible development, most if not all zoning documents for Vancouver also have conditionally permissible exceptions, with their own set of restrictions, that may only apply to certain parts of the zoning area. Furthermore, special case areas such as neighbourhoods near an airport will typically have stricter height limits. Thus ArcGIS Urban also allows for overlay layers, which essentially handle these exceptions by overriding certain restrictions of the underlying zoning layer. As Metro Vancouver 2040 seeks to focus substantial development in frequent transit development areas, I used an overlay to override the typical height limitations of the area.
You can further assess the impact of potential new buildings with analysis tools that can be applied directly in the scene. Users can enable zoning envelope visibility to visualize the maximum volume of available development space on a parcel and compare it to the amount of space that is currently occupied. You can also slice buildings, measure area and distance, configure date and time settings to examine the shadowing effect of buildings, and perform line of sight analysis to determine what is or isn’t visible from a given vantage point. Thus, ArcGIS Urban allows you to quickly assess and compare potential planning scenarios, not only from a capacity standpoint but in terms of the visual impact on the surroundings, as well.
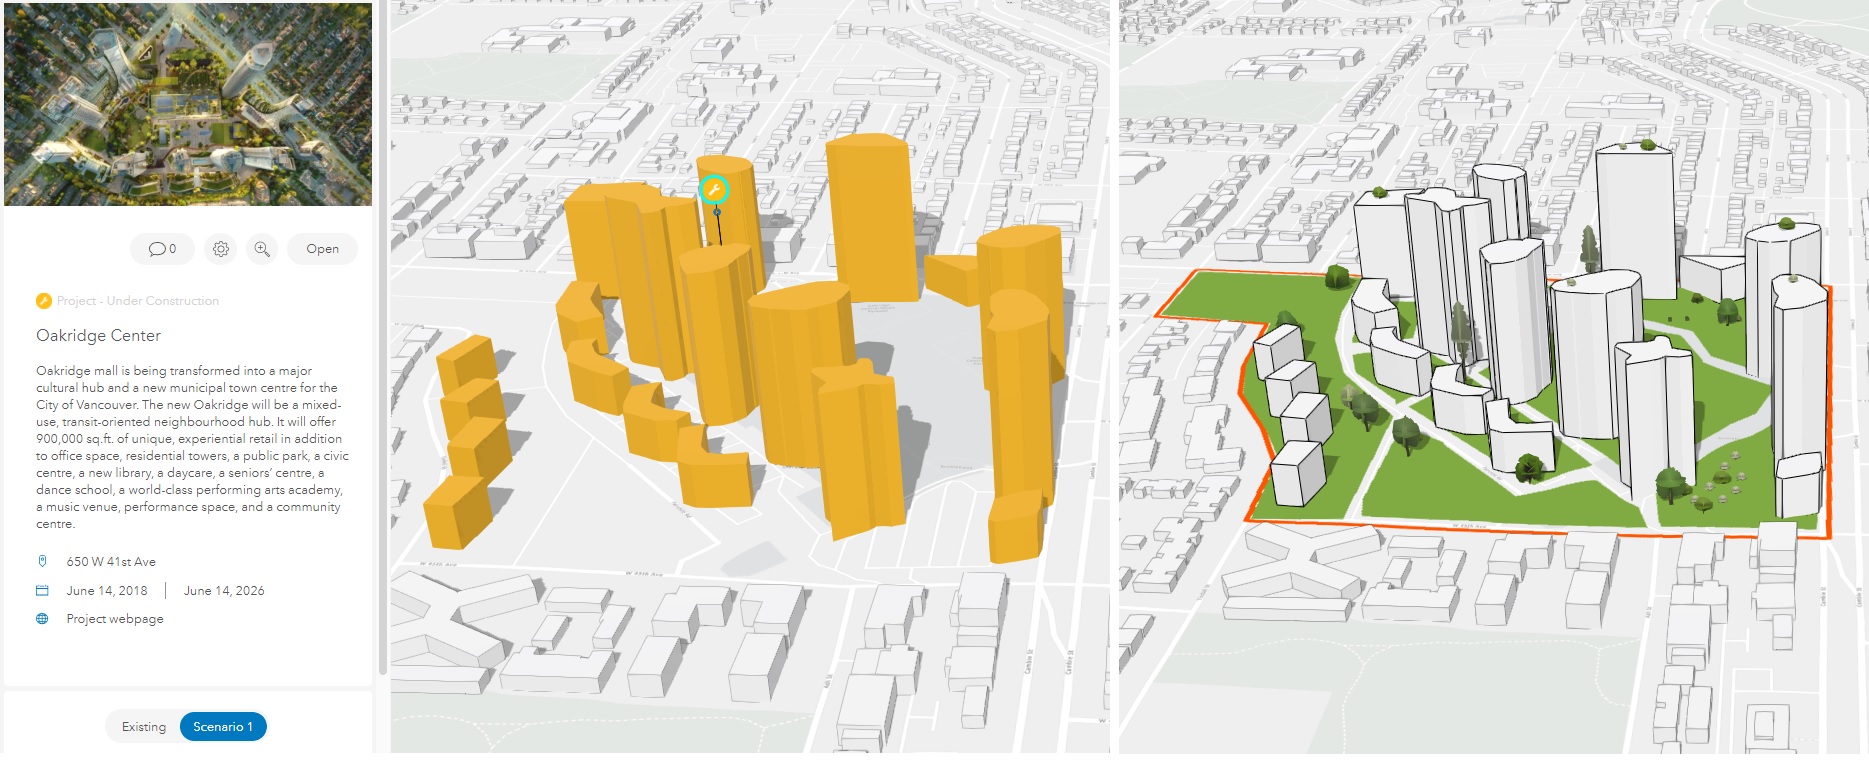
In addition to plans, ArcGIS Urban is also capable of modeling and tracking the status of various development projects, typically smaller scale short-term (1 – 5 years) endeavors. After creating a project card, you can use polygonal extrusion to create the basic project shape, and add ground coloration, vegetation, street furniture, and other assets for additional detail. Models created in third party software can also be imported. After you exit the project, it will be shaded according to your selected colour scheme to denote the current project status.
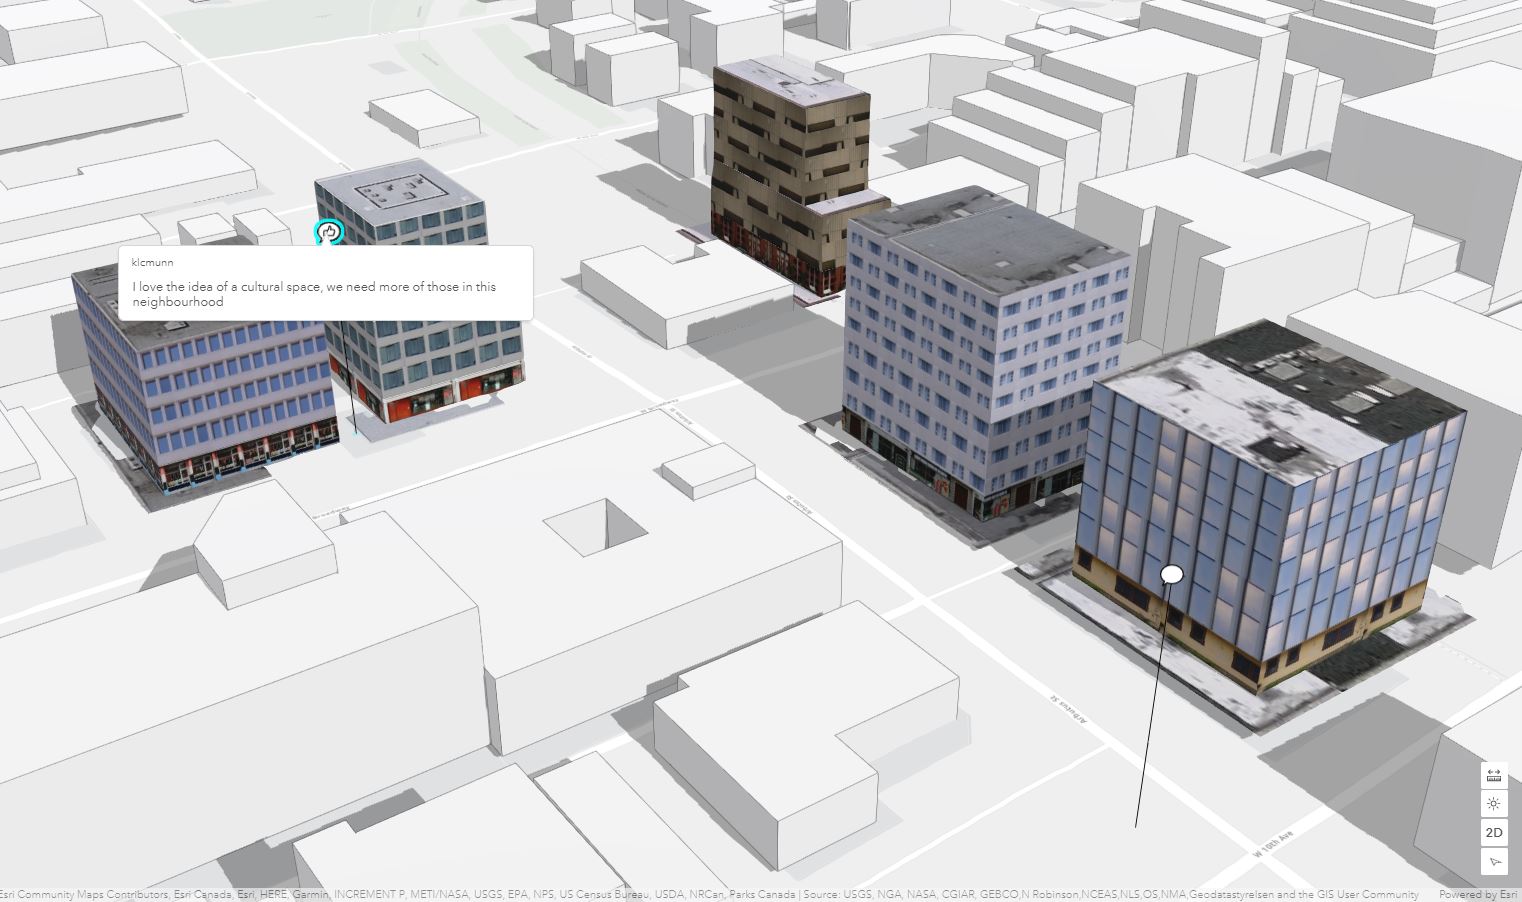
For enhanced realism, you can sync ArcGIS Urban with CityEngine and import the scene to texture building facades and access further asset options. Once the scene is complete, it is imported back into ArcGIS Urban for viewing. There is also an option to enable and configure various feedback categories, allowing public viewers to leave questions, concerns, or other comments regarding proposed plans and projects or general ideas for urban improvement.
All in all, ArcGIS Urban provides an invaluable urban planning tool that facilitates visually-oriented and collaborative decision-making by allowing for quick generation of plausible building forms and the resulting capacity metrics, while simplifying the implementation of zoning restrictions and enabling urban planners to share proposed plans and projects with the general public and obtain feedback. In fact, despite its relatively recent release date, several cities both large and small have already adopted the web-based application to improve their local planning processes and manage sustainable urban growth. With the quick modeling capabilities, analytical features, and user-friendly interface offered by ArcGIS Urban, these cities will be able to raise their urban plans to a whole new level.