
Custom point clustering for ArcGIS JavaScript API 4.6
When working on custom web mapping applications that need to display many point features, there is a natural need for point clustering for both performance and to improve the visualization of the point distribution. We’ve had the ability to do this for quite some time with the ArcGIS API for JavaScript in the 3.x version. You can also easily author web maps with point clustering enabled for up to 50k points in ArcGIS Online or Portal for ArcGIS. With clustering configured in an ArcGIS web map, you can use the createMap utility in the ArcGIS API for JavaScript 3.x to easily incorporate the map into a custom application.
There are certainly other alternatives for implementing client-side point clustering for web mapping applications, for example the Leaflet.markercluster library, or the Esri Leaflet Cluster library, which extends the Leaflet.markercluster to work with ArcGIS feature services.
For a recent project that I’ve been working on, we wanted to use the latest version of the ArcGIS API for JavaScript, version 4.6. However, this version of the API does not yet implement point clustering. Although this feature is coming soon, we wanted to be sure we could use the 4.6 version of the API for our application, and still be able to display point clusters in the map. To accomplish this, I took a bit of time to create a custom layer class that works with the 4.6 API that we could use temporarily for generating and displaying point clusters. This came together as a subclass of the ArcGIS JSAPI’s FeatureLayer class, which wraps the point clustering functionality of the supercluster module. The result of this combination is available in the clusterlayer repository in our GitHub account.
To use the this ClusterLayer object in a custom application, you can add the library to your dojoConfig, and import it like a typical AMD module using `require`. Once the library is loaded, you can create an instance of the ClusterLayer object with the same constructor options that you would use for a regular FeatureLayer. It supports feature services, feature layers created with client-side graphics, or a variation of the latter that loads a URL as a simple JSON data file. To control the behaviour and appearance of the clusters on the map, an additional constructor parameter named `supercluster` must be provided to specify clustering parameters, scripts for aggregating point attributes (e.g., if you want to do more than just count the number of points), a renderer used to display the aggregated attributes calculated for your clusters, and a popup template to display cluster details. Labelling can be enabled, though this is implemented by adding an additional graphics layer that draws each cluster’s point with a unique TextSymbol assigned to each point (labelling for 2D maps is also coming soon for the JavaScript API 4.x)
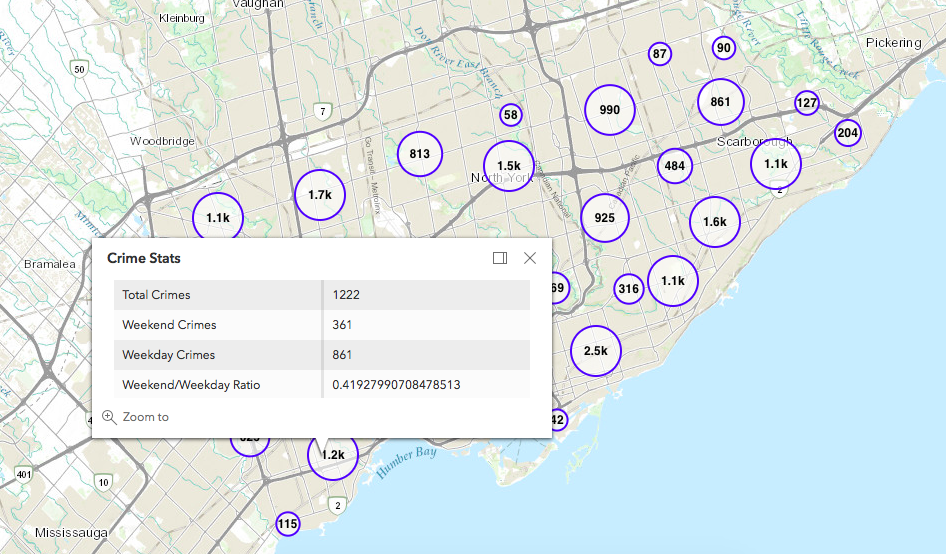
A worker object is used to perform the point clustering in the background, which helps prevent UI locking when larger datasets are being loaded. You can try several demos (linked from the README page on GitHub), which show clustering of a Feature Service with Toronto crime data (about 33k points), or randomly generated datasets with 10k and 50k points. The feature layer sample may take a bit of time to load in the background (while it queries the service), but the static 10k/50k datasets load very quickly. Although it’s a bit overkill, I was also curious to see if 1 million points could be loaded – you will find a demo for this too, but beware that it is a 40mb JSON file, and will likely exceed limits on mobile devices.
There are (at least) a few limitations with the current implementation:
- The ClusterLayer code is experimental – it is not tested to do anything beyond what is shown in the demos, and may not work as expected in different scenarios.
- Point loading can take a while when working against a large feature service with no definitionExpression applied, since all features will be downloaded before clusters are displayed. If/when time permits, I’d want to add some events to the ClusterLayer object and demonstrate UI feedback in the demos.
- Only the first mapView that the layer is added to will control the zoom/extent for which point clusters are displayed.
- Labelling is implemented using a graphics layer with TextSymbol objects created for each cluster (as noted above). If 2D labelling is added to the ArcGIS API for JavaScript 4.x before point clustering, then this can be revised.
- A map that has an instance of the ClusterLayer added to it can be added to a 3D SceneView, however it will require a different renderer (and maybe some revisions to the code).
- This code will be essentially unnecessary once the ArcGIS API for JavaScript 4.x version includes native support for point clustering.
When you create an instance of the ClusterLayer object using the URL to an ArcGIS Feature Service, you can control what features are included in the clusters using the definitionExpression property. You can provide this when creating the object, and/or update the property at any time after that. When the definition expression is set or modified, the underlying feature service will be queried for all matching features, and the clusters are regenerated.
Feel free to comment on the project in GitHub, and/or clone the repository and make pull requests if you would like to contribute any of your own changes/improvements to the code.