
Interesting Student Projects in GIS
During this past term, I was the TA for an introductory GIS course at York University. For most students, this course is their first contact with ArcGIS products, and the course culminates in an application-oriented final project. This year, the theme for the project was “Social Awareness and/or Crowd-Sourcing.” I was impressed with the students’ work, and wanted to share some of it.
GO Transit Extension
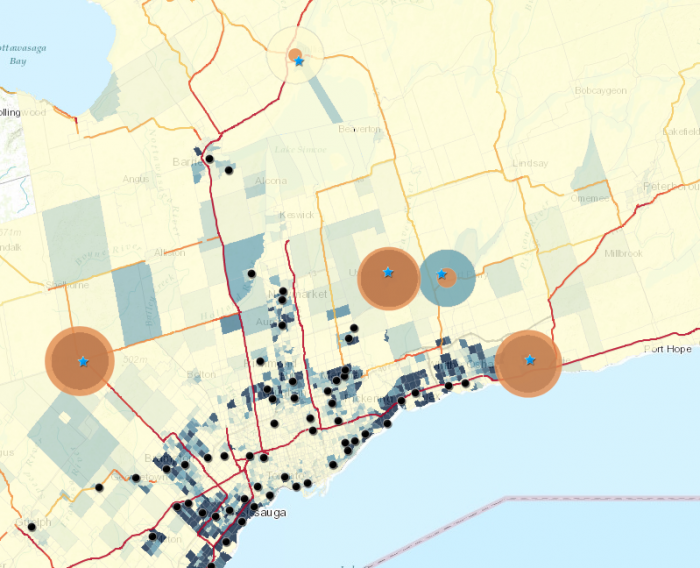
One group decided to address the issue of public transportation, specifically looking at potential new sites for a GO Train Station and assessing their suitability. Their suitability analysis sought to prioritize areas that have: large amounts of daily traffic, long average commuting times, and high existing levels of GO ridership. They found that the three proposed stations closest to the GTA were the most suitable sites for new stations, particularly in Orangeville and Bowmanville.
Analysis and Mapping of Air Pollutants in Canada
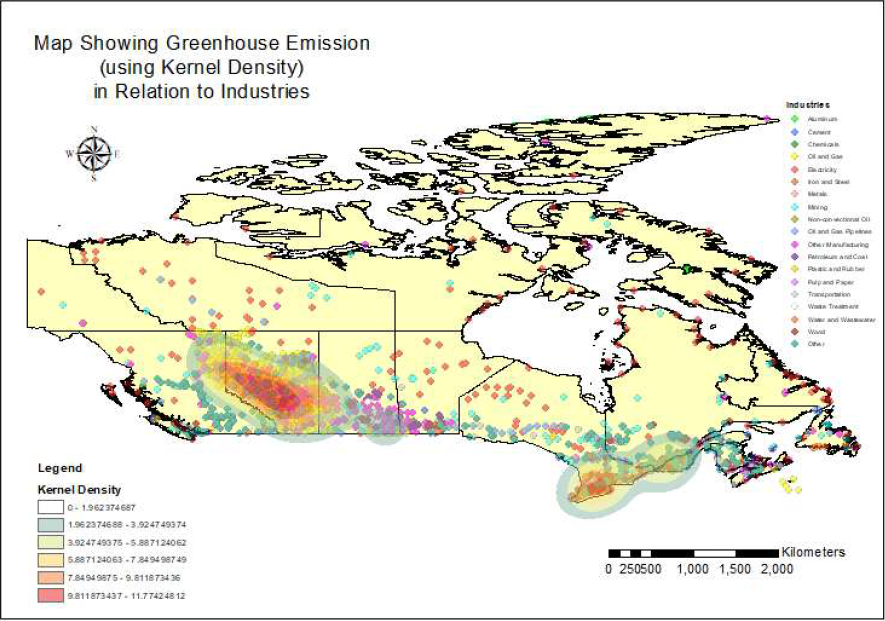
Another group looked at pollutant emission levels across Canada as it relates to industrialization, focusing on greenhouse gas and NOx emissions. They used a kernel density function to identify what areas produced the highest emissions in 2017. Their analysis showed that the highest overall emissions came from Western Canada and Southern Ontario.
Crowd-Sourcing the Weather
A group of Atmospheric Science students looked at crowd-sourced meteorological data, comparing their consistency and spatial density of sampling points. They found that crowd-sourced weather data were consistent with government-sourced data, and that they provided significant improvements to the provided level of detail due to the higher density of sampling points.

Racism in Employment
Another group sought to explore US employment/unemployment statistics and analyze how racial prejudices feed into broader patterns in employment data. They found that the black population consistently had the highest rates of unemployment among racial groups in each of the states they analyzed, even when the black population had higher employment levels than other racial groups. They paired this analysis with a Survey123 poll to gauge public opinion on the implications of this data.
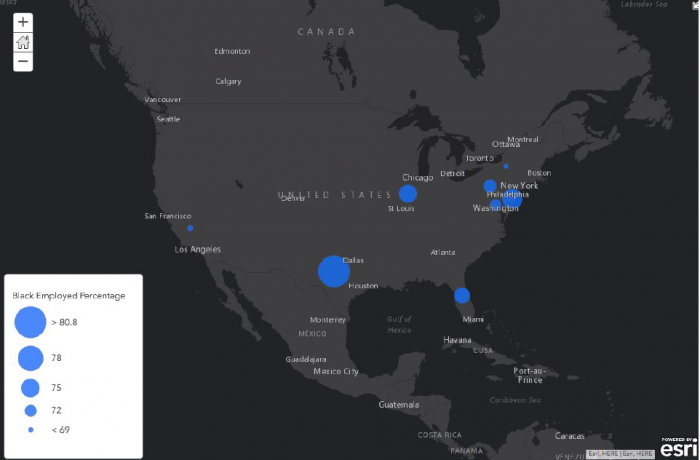
Link to Web Map | Link to Survey
Lyme Disease in Ontario
Another group wanted to improve public awareness of Lyme Disease in Ontario. They accomplished this by showing overall rates of Lyme Disease in Ontario’s Public Health Units, and they provided a means to report encounters with ticks through a Web Application.
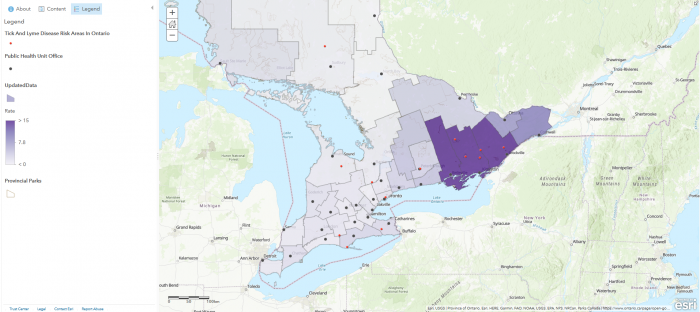
Link to Web Map | Link to Reporting Application